| ||||||||||||||||||||||||||||||||||||||||
36 of the 96 seats in the United States Senate[a] 49 seats needed for a majority | ||||||||||||||||||||||||||||||||||||||||
|---|---|---|---|---|---|---|---|---|---|---|---|---|---|---|---|---|---|---|---|---|---|---|---|---|---|---|---|---|---|---|---|---|---|---|---|---|---|---|---|---|
| ||||||||||||||||||||||||||||||||||||||||
 | ||||||||||||||||||||||||||||||||||||||||
The 1950 United States Senate elections occurred in the middle of Harry S. Truman's second term as president. The 32 seats of Class 3 were contested in regular elections, and four special elections were held to fill vacancies. As with most 20th-century second-term midterms, the party not holding the presidency made significant gains. The Republican opposition made a net gain of five seats, taking advantage of the Democratic administration's declining popularity during the Cold War and the aftermath of the Recession of 1949. The Democrats held a narrow 49-to-47-seat majority after the election. This was the first time since 1932 that the Senate majority leader lost his seat, and the only instance of the majority leader losing his seat while his party retained the majority.
Results summary
[edit]| 49 | 47 |
| Democratic | Republican |
Colored shading indicates party with largest share of that row.
| Parties | Total | ||||||||||||||||||||||||||||||||||||||||||||||||||||||||||||||||||||||||||||||||||||||||||||||||||
|---|---|---|---|---|---|---|---|---|---|---|---|---|---|---|---|---|---|---|---|---|---|---|---|---|---|---|---|---|---|---|---|---|---|---|---|---|---|---|---|---|---|---|---|---|---|---|---|---|---|---|---|---|---|---|---|---|---|---|---|---|---|---|---|---|---|---|---|---|---|---|---|---|---|---|---|---|---|---|---|---|---|---|---|---|---|---|---|---|---|---|---|---|---|---|---|---|---|---|---|
| Democratic | Republican | Other | |||||||||||||||||||||||||||||||||||||||||||||||||||||||||||||||||||||||||||||||||||||||||||||||||
| Last elections (1948) Before these elections |
54 | 42 | 0 | 96 | |||||||||||||||||||||||||||||||||||||||||||||||||||||||||||||||||||||||||||||||||||||||||||||||
| Not up | 31 | 29 | — | 60 | |||||||||||||||||||||||||||||||||||||||||||||||||||||||||||||||||||||||||||||||||||||||||||||||
| Up | 23 | 13 | — | 36 | |||||||||||||||||||||||||||||||||||||||||||||||||||||||||||||||||||||||||||||||||||||||||||||||
| Class 3 (1944→1950) | 20 | 12 | — | 32 | |||||||||||||||||||||||||||||||||||||||||||||||||||||||||||||||||||||||||||||||||||||||||||||||
| Special: Class 1 | 2 | 0 | — | 2 | |||||||||||||||||||||||||||||||||||||||||||||||||||||||||||||||||||||||||||||||||||||||||||||||
| Special: Class 2 | 1 | 1 | — | 2 | |||||||||||||||||||||||||||||||||||||||||||||||||||||||||||||||||||||||||||||||||||||||||||||||
| Incumbent retired | 3[b] | 1 | — | 4 | |||||||||||||||||||||||||||||||||||||||||||||||||||||||||||||||||||||||||||||||||||||||||||||||
| Held by same party | 2 | 1 | — | 3 | |||||||||||||||||||||||||||||||||||||||||||||||||||||||||||||||||||||||||||||||||||||||||||||||
| Replaced by other party | — | 1 | |||||||||||||||||||||||||||||||||||||||||||||||||||||||||||||||||||||||||||||||||||||||||||||||||
| Result | 2 | 2 | 0 | 4 | |||||||||||||||||||||||||||||||||||||||||||||||||||||||||||||||||||||||||||||||||||||||||||||||
| Incumbent ran | 20 | 12 | — | 32 | |||||||||||||||||||||||||||||||||||||||||||||||||||||||||||||||||||||||||||||||||||||||||||||||
| Won re-election | 12 | 10 | — | 22 | |||||||||||||||||||||||||||||||||||||||||||||||||||||||||||||||||||||||||||||||||||||||||||||||
| Lost re-election | — | 5 | |||||||||||||||||||||||||||||||||||||||||||||||||||||||||||||||||||||||||||||||||||||||||||||||||
| Lost renomination but held by same party |
3 | 1 | — | 4 | |||||||||||||||||||||||||||||||||||||||||||||||||||||||||||||||||||||||||||||||||||||||||||||||
| Lost renomination and party lost |
— | 1 | |||||||||||||||||||||||||||||||||||||||||||||||||||||||||||||||||||||||||||||||||||||||||||||||||
| Result | 16 | 16 | 0 | 32 | |||||||||||||||||||||||||||||||||||||||||||||||||||||||||||||||||||||||||||||||||||||||||||||||
| Total elected | 18 | 18 | 0 | 36 | |||||||||||||||||||||||||||||||||||||||||||||||||||||||||||||||||||||||||||||||||||||||||||||||
| Net change | 5 | ||||||||||||||||||||||||||||||||||||||||||||||||||||||||||||||||||||||||||||||||||||||||||||||||||
| Nationwide vote | 16,374,996 | 17,023,295 | 946,945 | 34,345,236 | |||||||||||||||||||||||||||||||||||||||||||||||||||||||||||||||||||||||||||||||||||||||||||||||
| Share | 47.68% | 49.57% | 2.76% | 100% | |||||||||||||||||||||||||||||||||||||||||||||||||||||||||||||||||||||||||||||||||||||||||||||||
| Result | 49 | 47 | 0 | 96 | |||||||||||||||||||||||||||||||||||||||||||||||||||||||||||||||||||||||||||||||||||||||||||||||
Source: Clerk of the U.S. House of Representatives[1]
Gains, losses, and holds
[edit]Retirements
[edit]One Republican and three Democrats retired instead of seeking re-election.
| State | Senator | Replaced by |
|---|---|---|
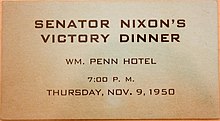
| California | Sheridan Downey | Richard Nixon |
| Kansas | Harry Darby | Frank Carlson |
| Kentucky | Garrett Withers | Earle Clements |
| Rhode Island | Edward L. Leahy | John Pastore |
Defeats
[edit]Two Republicans and eight Democrats sought re-election but lost in the primary or general election.
Post-election changes
[edit]| State | Senator | Replaced by |
|---|---|---|
| Connecticut | Brien McMahon | William A. Purtell |
| Kentucky | Virgil Chapman | Thomas R. Underwood |
| Michigan | Arthur Vandenberg | Blair Moody |
| Nebraska | Kenneth S. Wherry | Fred A. Seaton |
Change in composition
[edit]Before the elections
[edit]| D1 | D2 | D3 | D4 | D5 | D6 | D7 | D8 | ||
| D18 | D17 | D16 | D15 | D14 | D13 | D12 | D11 | D10 | D9 |
| D19 | D20 | D21 | D22 | D23 | D24 | D25 | D26 | D27 | D28 |
| D38 Fla. Ran |
D37 Conn. (sp) Ran |
D36 Conn. (reg) Ran |
D35 Calif. Retired |
D34 Ark. Ran |
D33 Ariz. Ran |
D32 Ala. Ran |
D31 | D30 | D29 |
| D39 Ga. Ran |
D40 Ky. (reg) Ky. (sp) Resigned |
D41 Idaho (reg) Ran |
D42 Ill. Ran |
D43 La. Ran |
D44 Md. Ran |
D45 Nev. Ran |
D46 N.Y. Ran |
D47 N.C. (reg) Ran |
D48 N.C. (sp) Ran |
| Majority → | D49 Okla. Ran | ||||||||
| R39 Ore. Ran |
R40 S.D. Ran |
R41 Vt. Ran |
R42 Wisc. Ran |
D54 Wash. Ran |
D53 Utah Ran |
D52 S.C. Ran |
D51 R.I. (sp) Retired |
D50 Pa. Ran | |
| R38 Ohio Ran |
R37 N.D. Ran |
R36 N.H. Ran |
R35 Mo. Ran |
R34 Kan. (reg) Kan. (sp) Retired |
R33 Iowa Ran |
R32 Ind. Ran |
R31 Idaho (sp) Ran |
R30 Colo. Ran |
R29 |
| R19 | R20 | R21 | R22 | R23 | R24 | R25 | R26 | R27 | R28 |
| R18 | R17 | R16 | R15 | R14 | R13 | R12 | R11 | R10 | R9 |
| R1 | R2 | R3 | R4 | R5 | R6 | R7 | R8 | ||
Results of the elections
[edit]| D1 | D2 | D3 | D4 | D5 | D6 | D7 | D8 | ||
| D18 | D17 | D16 | D15 | D14 | D13 | D12 | D11 | D10 | D9 |
| D19 | D20 | D21 | D22 | D23 | D24 | D25 | D26 | D27 | D28 |
| D38 Ga. Re-elected |
D37 Fla. Hold |
D36 Conn. (sp) Elected[c] |
D35 Conn. (reg) Re-elected |
D34 Ark. Re-elected |
D33 Ariz. Re-elected |
D32 Ala. Re-elected |
D31 | D30 | D29 |
| D39 Ky. (reg) Ky. (sp) Hold |
D40 La. Re-elected |
D41 Nev. Re-elected |
D42 N.Y. Re-elected |
D43 N.C. (reg) Re-elected |
D44 N.C. (sp) Hold |
D45 Okla. Hold |
D46 R.I. (sp) Hold |
D47 S.C. Re-elected |
D48 Wash. Re-elected |
| Majority → | D49 Mo. Gain | ||||||||
| R39 S.D. Hold |
R40 Vt. Re-elected |
R41 Wisc. Re-elected |
R42 Calif. Gain |
R43 Idaho (reg) Gain |
R44 Ill. Gain |
R45 Md. Gain |
R46 Pa. Gain |
R47 Utah Gain | |
| R38 Ore. Re-elected |
R37 Ohio Re-elected |
R36 N.D. Re-elected |
R35 N.H. Re-elected |
R34 Kan. (reg) Kan. (sp) Hold |
R33 Iowa Re-elected |
R32 Ind. Re-elected |
R31 Idaho (sp) Elected[c] |
R30 Colo. Re-elected |
R29 |
| R19 | R20 | R21 | R22 | R23 | R24 | R25 | R26 | R27 | R28 |
| R18 | R17 | R16 | R15 | R14 | R13 | R12 | R11 | R10 | R9 |
| R1 | R2 | R3 | R4 | R5 | R6 | R7 | R8 | ||
| Key: |
|
|---|
Race summaries
[edit]Special elections during the 81st Congress
[edit]In these special elections, the winners were seated during 1950 or before January 3, 1951; ordered by election date.
| State (linked to summaries below) |
Incumbent | Results (linked to election articles) |
Candidates | ||
|---|---|---|---|---|---|
| Senator | Party | Electoral history | |||
| Connecticut (Class 1) |
William Benton | Democratic | 1949 (Appointed) | Interim appointee elected November 7, 1950. |
|
| Idaho (Class 2) |
Henry Dworshak | Republican | 1946 (special) 1948 (Lost) 1949 (Appointed) |
Interim appointee elected November 7, 1950. |
|
| Kansas (Class 3) |
Harry Darby | Republican | 1949 (Appointed) | Interim appointee retired November 28, 1950 when successor's election was certified. Successor elected November 7, 1950. Republican hold. Winner was also elected to finish the term; see below. |
|
| Kentucky (Class 3) |
Garrett Withers | Democratic | 1949 (Appointed) | Interim appointee resigned to trigger special election. Successor elected November 7, 1950. Democratic hold. Winner was also elected to finish the term; see below. |
|
| North Carolina (Class 2) |
Frank Porter Graham | Democratic | 1949 (Appointed) | Interim appointee lost nomination to finish term. Winner elected November 7, 1950. Democratic hold. |
|
| Rhode Island (Class 1) |
Edward L. Leahy | Democratic | 1949 (Appointed) | Interim appointee retired. Winner elected November 7, 1950. Democratic hold. |
|
Races leading to the 82nd Congress
[edit]In these regular elections, the winner was seated on January 3, 1951; ordered by state.
All of the elections involved the Class 3 seats.
| State (linked to summaries below) |
Incumbent | Results (linked to election articles) |
Candidates | ||
|---|---|---|---|---|---|
| Senator | Party | Electoral history | |||
| Alabama | J. Lister Hill | Democratic | 1938 (Appointed) 1938 (special) 1938 1944 |
Incumbent re-elected. |
|
| Arizona | Carl Hayden | Democratic | 1926 1932 1938 1944 |
Incumbent re-elected. |
|
| Arkansas | J. William Fulbright | Democratic | 1944 | Incumbent re-elected. |
|
| California | Sheridan Downey | Democratic | 1938 1944 |
Incumbent renominated, but then retired due to ill health. New senator elected. Republican gain. Winner was appointed December 1, 1950 to finish the therm. |
|
| Colorado | Eugene Millikin | Republican | 1941 (Appointed) 1942 1944 |
Incumbent re-elected. |
|
| Connecticut | Brien McMahon | Democratic | 1944 | Incumbent re-elected. |
|
| Florida | Claude Pepper | Democratic | 1936 (special) 1938 1944 |
Incumbent lost renomination. New senator elected. Democratic hold.[2] |
|
| Georgia | Walter F. George | Democratic | 1922 (special) 1926 1932 1938 1944 |
Incumbent re-elected. |
|
| Idaho | Glen H. Taylor | Democratic | 1944 | Incumbent lost renomination. New senator elected. Republican gain. |
|
| Illinois | Scott W. Lucas | Democratic | 1938 1944 |
Incumbent lost re-election. New senator elected. Republican gain. |
|
| Indiana | Homer E. Capehart | Republican | 1944 | Incumbent re-elected. |
|
| Iowa | Bourke B. Hickenlooper | Republican | 1944 | Incumbent re-elected. |
|
| Kansas | Harry Darby | Republican | 1949 (Appointed) | Incumbent retired. New senator elected. Republican hold. Winner was also elected to finish the current term; see above. |
|
| Kentucky | Garrett Withers | Democratic | 1949 (Appointed) | Incumbent retired. New senator elected. Democratic hold. Incumbent resigned to trigger special election and winner was also elected to finish the current term; see above. |
|
| Louisiana | Russell B. Long | Democratic | 1948 (special) | Incumbent re-elected. |
|
| Maryland | Millard Tydings | Democratic | 1944 | Incumbent lost re-election. New senator elected. Republican gain. |
|
| Missouri | Forrest C. Donnell | Republican | 1944 | Incumbent lost re-election. New senator elected. Democratic gain. |
|
| Nevada | Pat McCarran | Democratic | 1932 1938 1944 |
Incumbent re-elected. |
|
| New Hampshire | Charles W. Tobey | Republican | 1938 1944 |
Incumbent re-elected. |
|
| New York | Herbert H. Lehman | Democratic | 1949 (special) | Incumbent re-elected. |
|
| North Carolina | Clyde R. Hoey | Democratic | 1932 1932 (special) 1938 1944 |
Incumbent re-elected. |
|
| North Dakota | Milton Young | Republican | 1945 (Appointed) 1946 (special) |
Incumbent re-elected. |
|
| Ohio | Robert A. Taft | Republican | 1938 1944 |
Incumbent re-elected. |
|
| Oklahoma | Elmer Thomas | Democratic | 1926 1932 1938 1944 |
Incumbent lost renomination. New senator elected. Democratic hold. |
|
| Oregon | Wayne Morse | Republican | 1944 | Incumbent re-elected. |
|
| Pennsylvania | Francis J. Myers | Democratic | 1944 | Incumbent lost re-election. New senator elected. Republican gain. |
|
| South Carolina | Olin D. Johnston | Democratic | 1944 | Incumbent re-elected. |
|
| South Dakota | Chan Gurney | Republican | 1938 1944 |
Incumbent lost renomination. New senator elected. Republican hold. |
|
| Utah | Elbert D. Thomas | Democratic | 1932 1938 1944 |
Incumbent lost re-election. New senator elected. Republican gain. |
|
| Vermont | George Aiken | Republican | 1940 (special) 1944 |
Incumbent re-elected. |
|
| Washington | Warren Magnuson | Democratic | 1944 (Appointed) 1944 |
Incumbent re-elected. |
|
| Wisconsin | Alexander Wiley | Republican | 1938 1944 |
Incumbent re-elected. |
|
Closest races
[edit]Fifteen races had a margin of victory under 10%:
| State | Party of winner | Margin |
|---|---|---|
| Connecticut (special) | Democratic | 0.1% |
| Pennsylvania | Republican (flip) | 3.6% |
| Idaho (special) | Republican | 3.8% |
| New York | Democratic | 5.0% [d] |
| Connecticut | Democratic | 5.1% |
| Indiana | Republican | 6.4% |
| Colorado | Republican | 6.5% |
| Maryland | Republican (flip) | 7.0% |
| Wisconsin | Republican | 7.1% |
| Missouri | Democratic (flip) | 7.2% |
| Washington | Democratic | 7.4% |
| Utah | Republican (flip) | 8.03% |
| Illinois | Republican (flip) | 8.12% |
| Kentucky | Democratic | 9.1% |
| Oklahoma | Democratic | 9.2% |
Alabama
[edit]
| |||||||||||||||||
| |||||||||||||||||
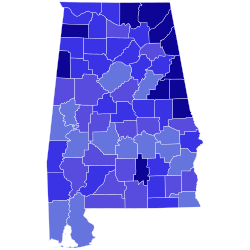 County results Hill: 60–70% 70–80% 80–90% >90% | |||||||||||||||||
| |||||||||||||||||
| Party | Candidate | Votes | % | ±% | |
|---|---|---|---|---|---|
| Democratic | J. Lister Hill (incumbent) | 125,534 | 76.54% | ||
| Independent | John G. Crommelin | 38,477 | 23.46% | N/A | |
| Total votes | 164,011 | 100.00% | |||
| Democratic hold | Swing | ||||
Arizona
[edit]
| |||||||||||||||||
| |||||||||||||||||
 County results Hayden: 50–60% 60–70% 70–80% 80–90% | |||||||||||||||||
| |||||||||||||||||
Incumbent Democratic U.S. senator Carl Hayden ran for re-election to a fifth term, defeating Republican nominee Bruce Brockett in the general election. Brockett was formerly the Republican nominee for governor in both 1946 and 1948. Hayden first defeated Cecil H. Miller and Robert E. Miller (of the Arizona Farm Bureau), for the Democratic nomination.
| Party | Candidate | Votes | % | |
|---|---|---|---|---|
| Democratic | Carl Hayden (incumbent) | 95,544 | 70.97% | |
| Democratic | Cecil H. Miller | 24,340 | 18.08% | |
| Democratic | Robert E. Miller | 14,752 | 10.96% | |
| Total votes | 134,636 | 100.00% | ||
| Party | Candidate | Votes | % | |
|---|---|---|---|---|
| Democratic | Carl Hayden (incumbent) | 116,246 | 62.80% | |
| Republican | Bruce Brockett | 68,846 | 37.20% | |
| Majority | 47,400 | 25.60% | ||
| Turnout | 185,092 | |||
| Democratic hold | ||||
Arkansas
[edit]
| Party | Candidate | Votes | % | |
|---|---|---|---|---|
| Democratic | J. William Fulbright (incumbent) | 302,686 | 100.00% | |
| Democratic hold | ||||
California
[edit]
| |||||||||||||||||
| |||||||||||||||||
 County results
Nixon: 50–60% 60–70% 70–80% Douglas: 50–60% | |||||||||||||||||
| |||||||||||||||||
| Party | Candidate | Votes | % | |
|---|---|---|---|---|
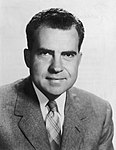
| Republican | Richard Nixon | 2,183,454 | 59.23% | |
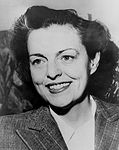
| Democratic | Helen Gahagan Douglas | 1,502,507 | 40.76% | |
| None | Scattering | 354 | 0.01% | |
| Majority | 680,947 | 18.47% | ||
| Turnout | 3,686,315 | |||
| Republican gain from Democratic | ||||
Colorado
[edit]
| |||||||||||||||||
| |||||||||||||||||
 Results by county Millikin: 50–60% 60–70% Carroll: 50–60% 60–70% | |||||||||||||||||
| |||||||||||||||||
| Party | Candidate | Votes | % | |
|---|---|---|---|---|
| Republican | Eugene Millikin (incumbent) | 239,724 | 53.25% | |
| Democratic | John A. Carroll | 210,442 | 46.75% | |
| Majority | 29,282 | 6.50% | ||
| Turnout | 450,166 | |||
| Republican hold | ||||
Connecticut
[edit]Connecticut (special)
[edit]
| |||||||||||||||||
| |||||||||||||||||
Benton: 40–50% 50–60% 60-70% Bush: 50-60% 60-70% 70-80% 80-90% Tie: 50% | |||||||||||||||||
| |||||||||||||||||
| Party | Candidate | Votes | % | |
|---|---|---|---|---|
| Democratic | William Benton (incumbent) | 431,413 | 50.06% | |
| Republican | Prescott Bush | 430,311 | 49.94% | |
| Majority | 1,102 | 0.08% | ||
| Turnout | 861,724 | |||
| Democratic hold | ||||
Connecticut (regular)
[edit]
| |||||||||||||||||
| |||||||||||||||||
McMahon: 50–60% 60-70% 70-80% Talbot: 50-60% 60-70% 70-80% 80-90% No Data/Vote: | |||||||||||||||||
| |||||||||||||||||
| Party | Candidate | Votes | % | |
|---|---|---|---|---|
| Democratic | Brien McMahon (incumbent) | 453,646 | 52.58% | |
| Republican | Joseph E. Talbot | 409,053 | 47.42% | |
| Majority | 44,593 | 5.16% | ||
| Turnout | 862,699 | |||
| Democratic hold | ||||
Florida
[edit]
| |||||||||||||||||
| |||||||||||||||||
 County results Smathers: 50–60% 60–70% 70–80% 80–90% >90% Booth: 50–60% | |||||||||||||||||
| |||||||||||||||||
Democratic incumbent Senator Claude Pepper lost renomination May 2, 1950 to George A. Smathers, who easily won the general election.[2]

The Democratic primary for the 1950 United States Senate election in Florida was described as the "most bitter and ugly campaigns in Florida political history." Ormund Powers, a Central Florida historian, noted that ABC and NBC commentator David Brinkley said that "the Pepper-Smathers campaign would always stand out in his mind as the dirtiest in the history of American politics". On January 12, 1950, U.S. Representative George A. Smathers declared his candidacy for the race in Orlando at Kemp's Coliseum, where about 3,000 supporters had gathered.[6] In his opening speech, Smathers accused Pepper of being "the leader of the radicals and extremists", an advocate of treason, and a person against the constitutional rights of Americans.[7] Ed Ball, a power in state politics who had broken with Pepper, financed his opponent, Smathers.[8]
Prior to the entry of Smathers and Pepper, Orlando attorney James G. Horrell campaigned for the seat. Horrell researched Pepper's weaknesses and the state's voters. Horrell also compiled a list of communist-front groups that Pepper had communicated with. On the day that Pepper declared his candidacy, Horrell withdrew and endorsed Smathers. Horrell also sent his reports about Pepper to Smathers, which he used throughout the next few months. This would also prevent the chance of a run-off election. In late February and early March, the Jacksonville Journal conducted a poll in 11 counties important for the election. Smathers led by about 2-to-1 and dominated in Duval, Pinellas, and Volusia counties, while he was also statistically tied with Pepper in Dade, Escambia, and Hillsborough counties. However, Smathers did not trail in any of the 11 counties.[9]
Smathers repeatedly attacked "Red Pepper" for having communist sympathies, condemning both his support for universal health care and his alleged support for the Soviet Union. Pepper had traveled to the Soviet Union in 1945 and, after meeting Soviet leader Joseph Stalin, declared he was "a man Americans could trust."[8] Additionally, although Pepper supported universal health care, sometimes referred to as "socialized medicine", Smathers would vote for "socialized medicine" in the Senate when it was introduced as Medicare in 1965. In The Saturday Evening Post, even respected writer and notorious anti-segregation editor Ralph McGill labeled Pepper a "spell-binding pinko".[7] Beginning on March 28 and until the day of the primary, Smathers named one communist organization each day that Pepper addressed, starting with the American Slav Congress.[9]
Pepper's opponents circulated widely a 49-page booklet titled The Red Record of Senator Claude Pepper. It contained photographs and headlines from several communist publications such as the Daily Worker.[7] In April the Daily Worker endorsed Pepper, with Communist Party of Florida leader George Nelson warning that a Smathers victory would "strengthen the Dixiecrat-KKK forces in Florida as well as throughout the South."[9] The booklet also made it seem as if Pepper desired to give Russia nuclear bomb-making instructions, billions of dollars, and the United States' natural resources. There was also a double-page montage of Pepper in 1946 at New York City's Madison Square Garden with progressive Henry A. Wallace and civil rights activist Paul Robeson, and quoted Pepper speaking favorably of both of them.[7] Throughout the campaign, Pepper denied sympathizing with communism.[10]
Simultaneous to this election, then-U.S. House Representative Richard Nixon was running for the Senate seat in California. In a letter from Senator Karl E. Mundt of South Dakota, he told Nixon that "It occurs to me that if Helen is your opponent in the fall, something of a similar nature might well be produced", in reference to The Red Record of Senator Claude Pepper and a similar Democratic primary between Manchester Boddy and Helen Gahagan Douglas.[11]
Race also played a role in the election. Labor unions began a voter registration drive, which mostly added African Americans to the voter rolls. Smathers accused the "Northern labor bosses" of paying black people to register and vote for Pepper. Shortly after Smathers declared his candidacy, he indicated to the Florida Peace Officers Association that he would defend law enforcement officers for free if they were found guilty of civil rights violations.[7] With the election occurring during the era of racial segregation, Pepper was portrayed as favoring integration and interracial marriage. He was also labeled a "nigger lover" and accused by Orlando Sentinel publisher Martin Andersen of shaking hands with a black woman in Sanford. In Dade County, which had a significant black and Jewish population, doctored photographs depicting Smathers in a Ku Klux Klan hood were distributed.[12]
In the Groveland Case, four young African American men – Charles Greenlee, Walter Irvin, Samuel Shepherd, and Ernest Thomas – known as the Groveland Four, were accused of raping a 17-year old white women in Groveland on July 16, 1949. Thomas fled the area but was later shot and killed by police. Greenlee, Irvin, and Shepherd were convicted by an all-white jury. After the St. Petersburg Times questioned the verdict in April 1950, Lake County State Attorney J. W. Hunter, a supporter of Pepper, demanded that Pepper repudiate the news articles. However, Pepper refused. Hunter then denounced Pepper and endorsed Smathers. In addition to the racial violence, cross burning was also common at the time, with five in Jacksonville, ten in Orlando and Winter Park, and seventeen in the Tallahassee area.[9]
With the accusation of "Northern labor bosses" sending "the carpetbaggers of 1950" to Florida on his behalf, Pepper reminded voters that Smathers was born in New Jersey and sometimes referred to him as a "damn Yankee intruder". In response, Smathers decorated speaking platform in the colors of his alma mater at the University of Florida, orange and blue, while informing his supporters that Pepper graduated from Harvard Law School.[7]
Powers noted that throughout the campaign, "scarcely a day passed" without Andersen writing a news story, column, or editorial that was very positive of Smathers or highly critical of Pepper.[6] Thirty-eight daily newspapers in Florida endorsed Smathers, while only the St. Petersburg Times and The Daytona Beach News-Journal endorsed Pepper. Among the newspapers that supported Smathers were the Miami Herald, owned by John S. Knight, and the Miami Daily News, published by James M. Cox, a former Governor of Ohio and the Democratic Party nominee for the 1920 presidential election. However, Pepper's aides compared this situation to when Alf Landon was endorsed by more editors and newspapers than Franklin Roosevelt in 1936, but received far fewer votes than him.[13]
Smathers performed generally well across many areas of the state, with the exception of Miami, Tampa, and the Florida Panhandle. On the morning after the election, Andersen wrote on the front-page headline of the Orlando Sentinel, "Praise God From Whom All Blessings Flow ... We Have Won from Hell to Breakfast And From Dan to Beersheba ... And Staved Off Socialism", which was inspired by a headline in The New York Times celebrating Lawrence of Arabia's victory over the Turks in 1917.[6]
| Party | Candidate | Votes | % | |
|---|---|---|---|---|
| Democratic | George Smathers | 387,315 | 54.78% | |
| Democratic | Claude Pepper | 319,754 | 45.22% | |
| Total votes | 707,069 | 100% | ||
Smathers defeated Republican John P. Booth in a landslide in the general election on November 7. Results indicated that Smathers received 76.3% of the vote compared to just 23.7% for Booth. In the popular vote, Smathers garnered 238,987 votes versus 74,228 for Booth.[14] Smathers fared well throughout the state and won all but Pinellas County.[15]
| Party | Candidate | Votes | % | |
|---|---|---|---|---|
| Democratic | George A. Smathers | 238,987 | 76.30% | |
| Republican | John P. Booth | 74,228 | 23.70% | |
| Majority | 164,759 | 52.60% | ||
| Turnout | 313,215 | |||
| Democratic hold | ||||
Georgia
[edit]
| ||||||||||||||||||||
| ||||||||||||||||||||
| ||||||||||||||||||||
Five-term Democratic Senator Walter F. George was re-elected without opposition.
| Party | Candidate | Votes | % | |
|---|---|---|---|---|
| Democratic | Walter F. George (incumbent) | 261,290 | 100.00% | |
| Democratic hold | ||||
George would retire after this term.
Idaho
[edit]There were two elections on the same day due to the October 8, 1949 death of one-term Democrat Bert H. Miller.
Idaho (special)
[edit]
| |||||||||||||||||
| |||||||||||||||||
 County results Dworshak: 50–60% 60–70% Burtenshaw: 50–60% 60–70% | |||||||||||||||||
| |||||||||||||||||
Republican former-senator Henry Dworshak — who had lost re-election to Miller in 1948 — was appointed to continue the term pending a special election to the class 2 seat, which he then won.
| Party | Candidate | Votes | % | |
|---|---|---|---|---|
| Republican | Henry Dworshak (incumbent) | 104,608 | 51.86% | |
| Democratic | Claude J. Burtenshaw | 97,092 | 48.14% | |
| Majority | 7,516 | 3.72% | ||
| Turnout | 201,700 | 34.27% | ||
| Republican hold | ||||
Idaho (regular)
[edit]
| |||||||||||||||||
| |||||||||||||||||
 County results Welker: 50–60% 60–70% 70–80% Clark: 50–60% 60–70% | |||||||||||||||||
| |||||||||||||||||
One-term Democrat Glen H. Taylor lost renomination to the class 3 seat to his predecessor D. Worth Clark.[18] Taylor had beaten Clark for the Democratic nomination in 1944, and this year Clark did the same to him. However, in the general election, Clark was easily beaten by Republican State senator Herman Welker.
| Party | Candidate | Votes | % | |
|---|---|---|---|---|
| Republican | Herman Welker | 124,237 | 61.68% | |
| Democratic | D. Worth Clark | 77,180 | 38.32% | |
| Majority | 47,057 | 23.36% | ||
| Turnout | 201,417 | 34.22% | ||
| Republican gain from Democratic | ||||
Illinois
[edit]
| |||||||||||||||||
| |||||||||||||||||
 County results Dirksen: 40–50% 50-60% 60-70% 70-80% Lucas: 40–50% 50–60% 60–70% | |||||||||||||||||
| |||||||||||||||||
| Party | Candidate | Votes | % | |
|---|---|---|---|---|
| Republican | Everett Dirksen | 1,951,984 | 53.88% | |
| Democratic | Scott W. Lucas (incumbent) | 1,657,630 | 45.76% | |
| Prohibition | Enoch A. Holtwick | 13,050 | 0.36% | |
| Write-in | Others | 9 | 0.00 | |
| Majority | 294,354 | 8.12% | ||
| Turnout | 3,622,673 | |||
| Republican gain from Democratic | ||||
Indiana
[edit]
| |||||||||||||||||
| |||||||||||||||||
 County results Capehart: 40-50% 50–60% 60–70% Campbell: 40-50% 50–60% | |||||||||||||||||
| |||||||||||||||||
First-term Republican Homer E. Capehart was re-elected.
| Party | Candidate | Votes | % | |
|---|---|---|---|---|
| Republican | Homer E. Capehart (incumbent) | 844,303 | 52.81% | |
| Democratic | Alexander M. Campbell | 741,025 | 46.35% | |
| Prohibition | Lester N. Abel | 13,396 | 0.84% | |
| Majority | 103,278 | 6.46% | ||
| Turnout | 1,598,724 | 40.64% | ||
| Republican hold | ||||
Capehart would win re-election again in 1956, but lose his seat in 1962.
Iowa
[edit]
| |||||||||||||||||
| |||||||||||||||||
 Hickenlooper: 50–60% 60–70% Loveland: 40–50% 50–60% | |||||||||||||||||
| |||||||||||||||||
One-term Republican Bourke B. Hickenlooper was re-elected.
| Party | Candidate | Votes | % | |
|---|---|---|---|---|
| Republican | Bourke B. Hickenlooper (incumbent) | 470,613 | 54.82% | |
| Democratic | Albert J. Loveland | 383,766 | 44.70% | |
| Prohibition | Z. Everett Kellum | 3,273 | 0.38% | |
| States' Rights | Ernest J. Seemann | 571 | 0.07% | |
| Socialist Labor | Leslie O. Ludwig | 300 | 0.03% | |
| Majority | 86,847 | 10.12% | ||
| Turnout | 858,523 | 32.75% | ||
| Republican hold | ||||
Hickenlooper would continue serving in the Senate until his retirement in 1969.
Kansas
[edit]There were two elections to the same seat on the same day due to the November 8, 1949 death of two-term Republican Clyde M. Reed. Governor of Kansas Frank Carlson appointed fellow Republican Harry Darby December 2, 1949 to continue the term, pending a special election. Carlson won both elections and was seated November 29, 1950.
Kansas (special)
[edit]
| |||||||||||||||||
| |||||||||||||||||
 County results Carlson: 50-60% 60-70% Aiken: 50–60% | |||||||||||||||||
| |||||||||||||||||
| Party | Candidate | Votes | % | |
|---|---|---|---|---|
| Republican | Frank Carlson | 321,718 | 55.17% | |
| Democratic | Paul Aiken | 261,405 | 44.83% | |
| Majority | 60,313 | 10.34% | ||
| Turnout | 583,123 | 30.61% | ||
| Republican hold | ||||
Kansas (regular)
[edit]
| |||||||||||||||||
| |||||||||||||||||
 County results Carlson: 40-50% 50-60% 60-70% Aiken: 40–50% 50–60% | |||||||||||||||||
| |||||||||||||||||
| Party | Candidate | Votes | % | |
|---|---|---|---|---|
| Republican | Frank Carlson | 335,880 | 54.25% | |
| Democratic | Paul Aiken | 271,365 | 43.83% | |
| Prohibition | Verne L. Damon | 11,859 | 1.92% | |
| Majority | 64,515 | 10.42% | ||
| Turnout | 619,104 | 32.49% | ||
| Republican hold | ||||
Kentucky
[edit]There were two elections to the same seat on the same day, due to the January 19, 1949 resignation of Democrat Alben W. Barkley to become U.S. vice president. Governor of Kentucky Earle Clements appointed fellow Democrat Garrett L. Withers to continue the term, pending a special election. The winner of the special election would complete the current term, from November until the start of the next Congress on January 3, while the regular election was for the full term from 1951 to 1957. Clements, himself, won both elections and was sworn in on November 27, 1950. Withers later served one term in the U.S. House of Representatives.
Kentucky (special)
[edit]| Party | Candidate | Votes | % | |
|---|---|---|---|---|
| Democratic | Earle Clements | 317,320 | 54.40% | |
| Republican | Charles I. Dawson | 265,994 | 45.60% | |
| Majority | 51,326 | 8.80% | ||
| Turnout | 583,314 | 19.82% | ||
| Democratic hold | ||||
Kentucky (regular)
[edit]
| |||||||||||||||||
 County results Clements: 40–50% 50–60% 60–70% 70–80% 80–90% Dawson: 40–50% 50–60% 60–70% 70–80% 80–90% | |||||||||||||||||
| |||||||||||||||||
| Party | Candidate | Votes | % | |
|---|---|---|---|---|
| Democratic | Earle Clements | 334,249 | 54.16% | |
| Republican | Charles I. Dawson | 278,368 | 45.11% | |
| Independent | James E. Olson | 4,496 | 0.73% | |
| Majority | 55,881 | 9.05% | ||
| Turnout | 617,113 | |||
| Democratic hold | ||||
Louisiana
[edit]
| |||||||||||||||||
| |||||||||||||||||
 Parish results Long: 70–80% 80–90% >90% | |||||||||||||||||
| |||||||||||||||||
| Party | Candidate | Votes | % | |
|---|---|---|---|---|
| Democratic | Russell Long (incumbent) | 220,907 | 87.72% | |
| Republican | Charles S. Gerth | 30,931 | 12.28% | |
| Majority | 189,976 | 75.44% | ||
| Turnout | 251,838 | |||
| Democratic hold | ||||
Maryland
[edit]
| |||||||||||||||||
| |||||||||||||||||
 County results Butler: 50–60% 60–70% Tydings: 40–50% 50–60% 60–70% | |||||||||||||||||
| |||||||||||||||||
| Party | Candidate | Votes | % | |
|---|---|---|---|---|
| Republican | John Marshall Butler | 326,921 | 53.00% | |
| Democratic | Millard E. Tydings (incumbent) | 283,180 | 46.00% | |
| Progressive | Sam Fox | 6,143 | 1.00% | |
| Majority | 43,741 | 7.00% | ||
| Turnout | 615,614 | |||
| Republican gain from Democratic | ||||
Missouri
[edit]
| |||||||||||||||||
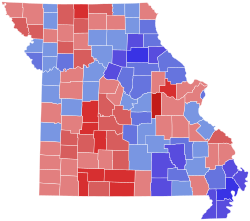 County results Hennings: 50–60% 60–70% 70–80% 80–90% Donnell: 50–60% 60–70% 70–80% 80–90% | |||||||||||||||||
| |||||||||||||||||
| Party | Candidate | Votes | % | |
|---|---|---|---|---|
| Democratic | Thomas C. Hennings Jr. | 685,732 | 53.60% | |
| Republican | Forrest C. Donnell (incumbent) | 592,922 | 46.34% | |
| Christian Nationalist | John W. Hamilton | 610 | 0.05% | |
| Socialist Labor | Henry W. Genck | 150 | 0.01% | |
| Majority | 92,810 | 7.26% | ||
| Turnout | 1,279,414 | |||
| Democratic gain from Republican | ||||
Nevada
[edit]
| |||||||||||||||||
| |||||||||||||||||
 County results McCarran: 50–60% 60–70% 70–80% Marshall: 50–60% | |||||||||||||||||
| |||||||||||||||||
| Party | Candidate | Votes | % | |
|---|---|---|---|---|
| Democratic | Pat McCarran (incumbent) | 35,829 | 58.01% | |
| Republican | George E. Marshall | 25,933 | 41.99% | |
| Majority | 9,896 | 16.02% | ||
| Turnout | 61,762 | |||
| Democratic hold | ||||
New Hampshire
[edit]
| |||||||||||||||||
| |||||||||||||||||
 County results Tobey: 50-60% 60-70% 70-80% Kelley: 60–70% | |||||||||||||||||
| |||||||||||||||||
| Party | Candidate | Votes | % | |
|---|---|---|---|---|
| Republican | Charles W. Tobey (incumbent) | 106,142 | 55.99% | |
| Democratic | Emmet J. Kelley | 72,473 | 38.23% | |
| Write-In | Wesley Powell | 10,943 | 5.77% | |
| Majority | 33,669 | 17.76% | ||
| Turnout | 189,558 | |||
| Republican hold | ||||
New York
[edit]
| ||||||||||||||||||||
| ||||||||||||||||||||
 County results Lehman: 40–50% 50–60% 60–70% Hanley: 40-50% 50-60% 60-70% 70–80% | ||||||||||||||||||||
| ||||||||||||||||||||
The Socialist Workers state convention met on July 9, and nominated Joseph Hansen for the U.S. Senate.[25]
The American Labor state convention met on September 6 and nominated W.E.B. DuBois for the U.S. Senate.[26]
The Republican state convention met on September 7 at Saratoga Springs, New York. They re-nominated Lieutenant Governor Joe R. Hanley for the U.S. Senate.[27]
The Democratic state convention met on September 7 at Rochester, New York, and re-nominated the incumbent U.S. senator Herbert H. Lehman.[28]
The Liberal state convention met on September 6 and 7 at the Statler Hotel in New York City, and endorsed Democratic nominee Lehman.[29]
Nearly the whole Republican statewide ticket was elected in a landslide, with only the Democratic incumbent U.S. senator, Ex-Governor Herbert H. Lehman, managing to stay in office.
| Party | Candidate | Votes | % | |
|---|---|---|---|---|
| Democratic | Herbert H. Lehman (incumbent) | 2,319,719 | 44.37% | |
| Republican | Joe R. Hanley | 2,367,353 | 45.28% | |
| Liberal | Herbert H. Lehman (incumbent) | 312,594 | 5.98% | |
| American Labor | W. E. B. Du Bois | 205,729 | 3.93% | |
| Socialist Workers | Joseph Hansen | 13,340 | 0.29% | |
| Industrial Government | Stephen Emery | 7,559 | 0.15% | |
| Majority | 264,960 | 5.07% | ||
| Turnout | 5,228,394 | |||
| Democratic hold | ||||
North Carolina
[edit]There were two elections in North Carolina.
North Carolina (special)
[edit]
| |||||||||||||||||
| |||||||||||||||||
 County results Smith: 50–60% 60–70% 70–80% 80–90% 90-100% Galvin: 50-60% 60-70% 70-80% | |||||||||||||||||
| |||||||||||||||||
| Party | Candidate | Votes | % | |
|---|---|---|---|---|
| Democratic | Willis Smith | 364,912 | 66.97% | |
| Republican | E. L. Galvin | 177,753 | 32.62% | |
| Write-In | Frank P. Graham (incumbent) | 2,259 | 0.41% | |
| Majority | 187,159 | 34.35% | ||
| Turnout | 544,924 | |||
| Democratic hold | ||||
North Carolina (regular)
[edit]
| |||||||||||||||||
| |||||||||||||||||
 County results Hoey: 50–60% 60–70% 70–80% 80–90% 90-100% Leavitt: 50-60% 60-70% 70-80% | |||||||||||||||||
| |||||||||||||||||
| Party | Candidate | Votes | % | |
|---|---|---|---|---|
| Democratic | Clyde R. Hoey (incumbent) | 376,472 | 68.66% | |
| Republican | Halsey B. Leavitt | 171,804 | 31.34% | |
| Majority | 204,668 | 37.32% | ||
| Turnout | 548,276 | |||
| Democratic hold | ||||
North Dakota
[edit]
| |||||||||||||||||
| |||||||||||||||||
 County results Young: 50-60% 60-70% 70-80% 80-90% O'Brien: 50-60% | |||||||||||||||||
| |||||||||||||||||
| Party | Candidate | Votes | % | |
|---|---|---|---|---|
| Republican | Milton R. Young (incumbent) | 126,209 | 67.59% | |
| Democratic | Harry O’Brien | 60,507 | 32.41% | |
| Majority | 65,702 | 35.18% | ||
| Turnout | 186,716 | |||
| Republican hold | ||||
Ohio
[edit]
| |||||||||||||||||
| |||||||||||||||||
 County results Taft: 50–60% 60–70% 70–80% Ferguson: 50–60% 60–70% | |||||||||||||||||
| |||||||||||||||||
| Party | Candidate | Votes | % | |
|---|---|---|---|---|
| Republican | Robert A. Taft (incumbent) | 1,645,643 | 57.54% | |
| Democratic | Joseph T. Ferguson | 1,214,459 | 42.46% | |
| Majority | 431,184 | 15.08% | ||
| Turnout | 2,860,102 | |||
| Republican hold | ||||
Oklahoma
[edit]
| |||||||||||||||||
| |||||||||||||||||
 County results Monroney: 50–60% 60–70% 70–80% 80–90% Alexander: 50–60% 60–70% | |||||||||||||||||
| |||||||||||||||||
| Party | Candidate | Votes | % | |
|---|---|---|---|---|
| Democratic | Mike Monroney | 345,953 | 54.81% | |
| Republican | W. H. ‘Bill’ Alexander | 285,224 | 45.19% | |
| Majority | 60,729 | 8.62% | ||
| Turnout | 631,177 | |||
| Democratic hold | ||||
Oregon
[edit]
| |||||||||||||||||
| |||||||||||||||||
 County results Morse: 60-70% 70-80% 80-90% | |||||||||||||||||
| |||||||||||||||||
| Party | Candidate | Votes | % | |
|---|---|---|---|---|
| Republican | Wayne Morse (incumbent) | 376,510 | 74.79% | |
| Democratic | Howard LaTourette | 116,780 | 23.20% | |
| Progressive | Harlin Talbert | 10,165 | 2.02% | |
| Majority | 259,730 | 51.59% | ||
| Turnout | 503,455 | |||
| Republican hold | ||||
Pennsylvania
[edit]
| |||||||||||||||||
| |||||||||||||||||
 County results Duff: 50–60% 60–70% 70–80% Myers: 40–50% 50–60% 60–70% | |||||||||||||||||
| |||||||||||||||||
| Party | Candidate | Votes | % | |
|---|---|---|---|---|
| Republican | James H. Duff | 1,820,400 | 51.30% | |
| Democratic | Francis J. Myers (incumbent) | 1,694,076 | 47.74% | |
| Prohibition | Earl N. Bergerstock | 12,618 | 0.36% | |
| G.I.’s Against Communism | Jack Sill | 8,353 | 0.24% | |
| Progressive | Lillian R. Narins | 5,516 | 0.16% | |
| Socialist | William J. Van Essen | 4,864 | 0.14% | |
| Industrial Government | Frank Knotek | 1,596 | 0.04% | |
| Militant Workers | Clyde A. Turner | 1,219 | 0.03% | |
| Majority | 126,324 | 3.56% | ||
| Turnout | 3,548,642 | |||
| Republican gain from Democratic | ||||
Rhode Island (special)
[edit]
| |||||||||||||||||
| |||||||||||||||||
 County results Pastore: 50–60% 60–70% Levy: 50-60% | |||||||||||||||||
| |||||||||||||||||
| Party | Candidate | Votes | % | |
|---|---|---|---|---|
| Democratic | John O. Pastore | 183,725 | 56.03% | |
| Republican | Austin T. Levy | 144,184 | 43.97% | |
| Majority | 39,541 | 12.06% | ||
| Turnout | 327,909 | |||
| Democratic hold | ||||
South Carolina
[edit]
| |||||||||||||||||
| |||||||||||||||||
 County results
Johnston: 50–60% 60–70% 70–80% Thurmond: 50-60% 60-70% 70–80% | |||||||||||||||||
| |||||||||||||||||
| Party | Candidate | Votes | % | |
|---|---|---|---|---|
| Democratic | Olin D. Johnston (incumbent) | 186,180 | 54.0% | |
| Democratic | Strom Thurmond | 158,904 | 46.0% | |
| Party | Candidate | Votes | % | |
|---|---|---|---|---|
| Democratic | Olin D. Johnston (incumbent) | 50,458 | 100.00% | |
| Democratic hold | ||||
South Dakota
[edit]
| |||||||||||||||||
| |||||||||||||||||
 County results Case: 50–60% 60–70% 70–80% 80–90% Engel: 50–60% 70–80% | |||||||||||||||||
| |||||||||||||||||
| Party | Candidate | Votes | % | |
|---|---|---|---|---|
| Republican | Francis Case | 160,670 | 63.92% | |
| Democratic | John A. Engel | 90,692 | 36.08% | |
| Majority | 69,978 | 27.84% | ||
| Turnout | 251,362 | |||
| Republican hold | ||||
Utah
[edit]
| |||||||||||||||||
| |||||||||||||||||
 County results Bennett: 40–50% 50–60% 60–70% 70–80% Thomas: 50–60% 60–70% | |||||||||||||||||
| |||||||||||||||||
| Party | Candidate | Votes | % | |
|---|---|---|---|---|
| Republican | Wallace F. Bennett | 142,427 | 53.86% | |
| Democratic | Elbert D. Thomas (incumbent) | 121,198 | 45.83% | |
| Independent | Bill Baker | 815 | 0.31% | |
| Majority | 21,229 | 8.03% | ||
| Turnout | 264,440 | |||
| Republican gain from Democratic | ||||
Vermont
[edit]
| |||||||||||||||||
| |||||||||||||||||
Municipal results Aiken: 50–60% 60–70% 70–80% 80–90% >90% Bigelow: 50–60% 60–70% No vote No data | |||||||||||||||||
| |||||||||||||||||
| Party | Candidate | Votes | % | |
|---|---|---|---|---|
| Republican | George Aiken (incumbent) | 69,543 | 77.99% | |
| Democratic | James E. Bigelow | 19,608 | 21.99% | |
| None | Scattering | 20 | 0.02% | |
| Majority | 49,935 | 56.00% | ||
| Turnout | 89,171 | |||
| Republican hold | ||||
Washington
[edit]
| |||||||||||||||||
| |||||||||||||||||
 County results Magnuson: 50–60% 60–70% Williams: 50–60% 60–70% | |||||||||||||||||
| |||||||||||||||||
| Party | Candidate | Votes | % | |
|---|---|---|---|---|
| Democratic | Warren G. Magnuson (incumbent) | 397,719 | 53.40% | |
| Republican | Walter Williams | 342,464 | 45.98% | |
| Independent | Herbert J. Phillips | 3,120 | 0.42% | |
| Socialist Labor | H. J. Churchward | 1,480 | 0.20% | |
| Majority | 55,255 | 7.42% | ||
| Turnout | 744,783 | |||
| Democratic hold | ||||
Wisconsin
[edit]
| |||||||||||||||||
| |||||||||||||||||
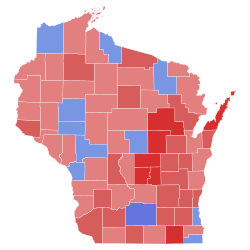 County results Wiley: 50–60% 60–70% 70–80% Fairchild: 50–60% 60–70% | |||||||||||||||||
| |||||||||||||||||
| Party | Candidate | Votes | % | |
|---|---|---|---|---|
| Republican | Alexander Wiley (incumbent) | 595,283 | 53.33% | |
| Democratic | Thomas E. Fairchild | 515,539 | 46.19% | |
| Socialist | Edwin Knappe | 3,972 | 0.36% | |
| Independent | Perry J. Stearns | 644 | 0.06% | |
| Independent | James E. Boulton | 332 | 0.03% | |
| Independent | Artemio Cozzini | 307 | 0.03% | |
| None | Scattering | 58 | 0.01% | |
| Majority | 79,744 | 7.14% | ||
| Turnout | 1,116,135 | |||
| Republican hold | ||||
See also
[edit]Notes
[edit]- ^ 32 regular elections and 4 specials
- ^ In California, Sheridan Downey was originally renominated, but retired due to ill health.
- ^ a b Appointee elected
- ^ New York was the "tipping point" state.
References
[edit]- ^ a b c d e f g h i j k l m n o p q r s t u v w x y z aa ab ac ad ae af ag ah ai aj ak al Clerk of the U.S. House of Representatives (January 11, 1951). "Statistics of the Presidential and Congressional Election of November 7, 1950" (PDF). U.S. Government Printing Office. pp. 5, 6–7, 26, 32, 40.
- ^ a b "FL US Senate". Our Campaigns. Retrieved June 18, 2013.
- ^ "Our Campaigns - AL US Senate Race - Nov 07, 1950". www.ourcampaigns.com. Retrieved August 27, 2020.
- ^ "Our Campaigns - AZ US Senate - D Primary Race - Sep 12, 1950". www.ourcampaigns.com. Retrieved December 21, 2017.
- ^ "Our Campaigns - AZ US Senate Race - Nov 07, 1950". www.ourcampaigns.com. Retrieved December 21, 2017.
- ^ a b c Joy Wallace Dickinson (September 24, 2000). "Florida's Senatorial Slugfest Was Bitter, Ugly, Legendary". Orlando Sentinel. Retrieved March 16, 2016.
- ^ a b c d e f Claude Denson Pepper and Hays Gorey (November 1987). Pepper: Eyewitness to a Century. San Diego, California: Harcourt. ISBN 978-0151716951.
- ^ a b Fund, John. Political Journal: George Smathers, RIP, January 24, 2007.
- ^ a b c d James C. Clark (1998). "The Campaign Begins". Road to Defeat: Claude Pepper and Defeat in the 1950 Florida Primary (Thesis). University of Florida. Retrieved April 6, 2016.
- ^ "Pepper Concedes It; Miamian's Lead Nears 70,000". The Daytona Beach News-Journal. Miami, Florida. Associated Press. May 3, 1950. Retrieved December 8, 2018.
- ^ Karl E. Mundt (May 9, 1950). "Letter from Sen. Karl Mundt to Richard Nixon, May 9, 1950, on file in the Richard M. Nixon Presidential Library and Museum, 1950 Senate race files, box 1".
{{cite journal}}: Cite journal requires|journal=(help) - ^ Andrews, Mark (December 13, 1998). "U.s. Senate Race Of '50 Was Black Mark On Campaigning". Orlando Sentinel. Retrieved April 5, 2016.
- ^ "Pepper-vs.-Smathers Race Close; Reds Issue in Florida Senate Drive". The New York Times. Lake Wales, Florida. April 6, 1950.
- ^ Statistics of the Congressional Election of November 7, 1950 (PDF) (Report). Washington, D.C.: United States House of Representatives. 1951. p. 6. Retrieved April 7, 2016.
- ^ "FL US Senate". Our Campaigns. Retrieved April 7, 2016.
- ^ "Our Campaigns - GA US Senate Race - Nov 07, 1950". www.ourcampaigns.com.
- ^ "Our Campaigns - ID US Senate - Special Election Race - Nov 07, 1950". www.ourcampaigns.com.
- ^ "Our Campaigns - ID US Senate - D Primary Race - Aug 08, 1950". www.ourcampaigns.com.
- ^ "Our Campaigns - ID US Senate Race - Nov 07, 1950". www.ourcampaigns.com.
- ^ "OFFICIAL VOTE of the STATE OF ILLINOIS Cast at the GENERAL ELECTION, November 7, 1950 JUDICIAL ELECTION, 1950, PRIMARY ELECTION General Primary, April 11, 1950" (PDF). Illinois State Board of Elections. Archived from the original (PDF) on October 13, 2021. Retrieved July 9, 2020.
- ^ "Our Campaigns - IA US Senate Race - Nov 07, 1950". www.ourcampaigns.com.
- ^ "Our Campaigns - KS US Senate - Special Election Race - Nov 07, 1950". www.ourcampaigns.com. Retrieved August 30, 2020.
- ^ "Our Campaigns - KS US Senate Race - Nov 07, 1950". www.ourcampaigns.com. Retrieved August 30, 2020.
- ^ "Our Campaigns - KY US Senate - Special Election Race - Nov 07, 1950". www.ourcampaigns.com.
- ^ "TROTSKYISTS PICK TICKET". The New York Times. July 10, 1950.
- ^ "TRUMAN SHAMMING, MARCANTONIO SAYS; ...Slate for A.L.P. Is Listed". The New York Times. September 7, 1950.
- ^ "LEADING CANDIDATES ON THE STATE REPUBLICAN PARTY'S TICKET". The New York Times. September 8, 1950.
- ^ "Lynch, Nominated, Accuses Dewey of 'Unholy Coalition'; Lehman, Balch, Young, D'Amanda Also in 'Balanced' Ticket". The New York Times. September 8, 1950.
- ^ "3 DEMOCRATS STIR LIBERAL'S REVOLT; Party Nominates Lehman and Lynch but Rejects Balch, Young and D'Amanda". The New York Times. September 8, 1950.
- "DEWEY'S PLURALITY OFFICIALLY 572,668; Canvassers' Tabulation Shows Lehman Defeated Hanley by Margin of 246,960". The New York Times. December 15, 1950.
- New York Red Book 1951
