| |||||||||||||||||||||||||||||||||||||||||
All 200 seats in the Landtag of North Rhine-Westphalia 101 seats needed for a majority | |||||||||||||||||||||||||||||||||||||||||
|---|---|---|---|---|---|---|---|---|---|---|---|---|---|---|---|---|---|---|---|---|---|---|---|---|---|---|---|---|---|---|---|---|---|---|---|---|---|---|---|---|---|
| Turnout | 8,641,646 (76.5% | ||||||||||||||||||||||||||||||||||||||||
| |||||||||||||||||||||||||||||||||||||||||
 Results for the single-member constituencies. | |||||||||||||||||||||||||||||||||||||||||
| |||||||||||||||||||||||||||||||||||||||||
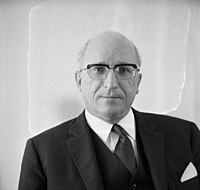
The 1966 North Rhine-Westphalia state election was held on 10 July 1966 to elect the 6th Landtag of North Rhine-Westphalia. The outgoing government was a coalition of the Christian Democratic Union (CDU) and Free Democratic Party (FDP) led by Minister-President Franz Meyers.
The opposition Social Democratic Party (SPD) became the largest party in the state for the first time, coming just short of a majority with 49.5% of votes and 99 seats. The CDU declined to 43%, and the FDP made a slight improvement to 7.4%.[1] Overall, the incumbent coalition retained a bare majority of 101 seats and was subsequently renewed. However, it only lasted a short time. The investiture of Meyers was troubled: he failed to win an absolute majority in the Landtag and was elected on the second ballot, which only required a simple majority, with 100 votes.[2][3]
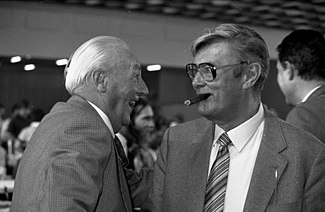
On 1 November, a new federal government took office in the form of a grand coalition between the CDU and SPD, replacing the previous CDU–FDP coalition. Fearing the same could occur in North Rhine-Westphalia, especially given the government's razor-thin majority, the FDP withdrew from the state government the same day and offered talks with the SPD. The CDU subsequently did the same, and though SPD leader Heinz Kühn initially supported a grand coalition, a clear majority of the SPD base and parliamentary group favoured the FDP. They came to an agreement and Kühn was elected Minister-President by the Landtag on 8 December, winning 112 votes in favour to 85 against. After this defeat, the CDU remained in opposition until 2005.[2][4] This marked the first time since Lower Saxony in 1959 (DP to SPD) that party control changed in a German state. Another state would not change hands before 1976, when Lower Saxony again changed from SPD to CDU government.
Electoral system
[edit]The Landtag was elected via mixed-member proportional representation. 150 members were elected in single-member constituencies via first-past-the-post voting, and fifty then allocated using compensatory proportional representation. A single ballot was used for both. An electoral threshold of 5% of valid votes is applied to the Landtag; parties that fall below this threshold are ineligible to receive seats.
Background
[edit]In the previous election held on 8 July 1962, the CDU lost its absolute majority but remained the largest party with a small lead over the SPD, 46% to 43%. They subsequently formed a coalition government with the FDP; in cabinet, the CDU had seven ministers and the FDP had two.
Parties
[edit]The table below lists parties represented in the 5th Landtag of North Rhine-Westphalia.
| Name | Ideology | Lead candidate |
1962 result | |||
|---|---|---|---|---|---|---|
| Votes (%) | Seats | |||||
| CDU | Christian Democratic Union of Germany Christlich Demokratische Union Deutschlands |
Christian democracy | Franz Meyers | 46.4% | 96 / 200
| |
| SPD | Social Democratic Party of Germany Sozialdemokratische Partei Deutschlands |
Social democracy | Heinz Kühn | 43.3% | 90 / 200
| |
| FDP | Free Democratic Party Freie Demokratische Partei |
Classical liberalism | Willi Weyer | 6.8% | 14 / 200
| |
Results
[edit]| Party | Votes | % | +/– | Seats | |||||
|---|---|---|---|---|---|---|---|---|---|
| Con. | List | Total | +/– | ||||||
| Social Democratic Party (SPD) | 4,226,604 | 49.48 | +6.21 | 99 | 0 | 99 | +9 | ||
| Christian Democratic Union (CDU) | 3,653,184 | 42.76 | –3.66 | 51 | 35 | 86 | –10 | ||
| Free Democratic Party (FDP) | 633,765 | 7.42 | +0.57 | 0 | 15 | 15 | +1 | ||
| Centre Party (ZENTRUM) | 16,181 | 0.19 | –0.74 | 0 | 0 | 0 | ±0 | ||
| Free Social Union (FSU) | 9,584 | 0.11 | New | 0 | 0 | 0 | New | ||
| Independent Workers' Party (UAP) | 3,175 | 0.04 | +0.03 | 0 | 0 | 0 | ±0 | ||
| Total | 8,542,493 | 100.00 | – | 150 | 50 | 200 | ±0 | ||
| Valid votes | 8,542,493 | 98.85 | |||||||
| Invalid/blank votes | 99,153 | 1.15 | |||||||
| Total votes | 8,641,646 | 100.00 | |||||||
| Registered voters/turnout | 11,291,597 | 76.53 | |||||||
| Source: [1] [2] | |||||||||
External links
[edit]- "Electoral system of North Rhine-Westphalia". Wahlrecht.de (in German). 15 May 2022. Retrieved 17 February 2023.
- "Tree change in Düsseldorf". Die Zeit (in German). 2 December 1966.
- "He shall come". Der Spiegel (in German). 4 December 1966.
References
[edit]- ^ "6th Landtag election on 10 July 1966". Landtag of North Rhine-Westphalia (in German). Retrieved 17 February 2023.
- ^ a b "The Year of Change, 1966". Landtag of North Rhine-Westphalia (in German). Retrieved 17 February 2023.
- ^ "Minutes of the Landtag session of 25 July 1966" (PDF). Landtag of North Rhine-Westphalia (in German). 25 July 1966.
- ^ "Minutes of the state parliament session of 8 December 1966" (PDF). Landtag of North Rhine-Westphalia (in German). 8 December 1966.


