Battiest | |
|---|---|
| Coordinates: 34°23′36″N 94°55′30″W / 34.39333°N 94.92500°W | |
| Country | United States |
| State | Oklahoma |
| County | McCurtain |
| Time zone | UTC-6 (Central (CST)) |
| • Summer (DST) | UTC-5 (CDT) |
| ZIP code | 74722 |
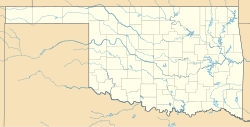
Battiest (/bəˈtiːst/ bə-TEEST) is a small, rural unincorporated village in McCurtain County, Oklahoma, United States. The population today is approximately 250 people. Businesses and services include a post office and comprehensive public school facilities.
History
[edit]The village was named for Choctaw jurist Byington Battiest. The post office was established November 1, 1926. Battiest is served by the Battiest Independent School District.
Climate
[edit]According to the Köppen Climate Classification system, Battiest has a humid subtropical climate, abbreviated "Cfa" on climate maps. The hottest temperature recorded in Battiest was 113 °F (45.0 °C) on August 4,2011, while the coldest temperature recorded was −14 °F (−25.6 °C) on February 16–17, 2021.[1]
| Climate data for Battiest, Oklahoma, 1991–2020 normals, extremes 1985–present | |||||||||||||
|---|---|---|---|---|---|---|---|---|---|---|---|---|---|
| Month | Jan | Feb | Mar | Apr | May | Jun | Jul | Aug | Sep | Oct | Nov | Dec | Year |
| Record high °F (°C) | 77 (25) |
84 (29) |
89 (32) |
94 (34) |
94 (34) |
108 (42) |
109 (43) |
113 (45) |
106 (41) |
92 (33) |
85 (29) |
80 (27) |
113 (45) |
| Mean maximum °F (°C) | 69.8 (21.0) |
73.7 (23.2) |
80.7 (27.1) |
84.6 (29.2) |
87.4 (30.8) |
92.2 (33.4) |
98.3 (36.8) |
98.5 (36.9) |
94.0 (34.4) |
86.3 (30.2) |
77.3 (25.2) |
70.6 (21.4) |
100.4 (38.0) |
| Mean daily maximum °F (°C) | 51.7 (10.9) |
56.2 (13.4) |
64.2 (17.9) |
72.7 (22.6) |
78.8 (26.0) |
86.3 (30.2) |
91.3 (32.9) |
91.5 (33.1) |
84.8 (29.3) |
73.9 (23.3) |
62.3 (16.8) |
53.8 (12.1) |
72.3 (22.4) |
| Daily mean °F (°C) | 39.1 (3.9) |
43.0 (6.1) |
50.6 (10.3) |
58.7 (14.8) |
67.3 (19.6) |
75.0 (23.9) |
79.2 (26.2) |
78.6 (25.9) |
71.7 (22.1) |
60.4 (15.8) |
49.1 (9.5) |
41.5 (5.3) |
59.5 (15.3) |
| Mean daily minimum °F (°C) | 26.5 (−3.1) |
29.8 (−1.2) |
36.9 (2.7) |
44.7 (7.1) |
55.9 (13.3) |
63.7 (17.6) |
67.2 (19.6) |
65.7 (18.7) |
58.5 (14.7) |
46.9 (8.3) |
36.0 (2.2) |
29.1 (−1.6) |
46.7 (8.2) |
| Mean minimum °F (°C) | 10.9 (−11.7) |
15.4 (−9.2) |
19.5 (−6.9) |
28.8 (−1.8) |
38.7 (3.7) |
52.3 (11.3) |
59.0 (15.0) |
56.1 (13.4) |
43.5 (6.4) |
29.5 (−1.4) |
20.3 (−6.5) |
14.9 (−9.5) |
7.8 (−13.4) |
| Record low °F (°C) | −2 (−19) |
−14 (−26) |
4 (−16) |
22 (−6) |
30 (−1) |
44 (7) |
50 (10) |
46 (8) |
32 (0) |
19 (−7) |
11 (−12) |
−4 (−20) |
−14 (−26) |
| Average precipitation inches (mm) | 3.71 (94) |
3.71 (94) |
5.15 (131) |
5.56 (141) |
6.66 (169) |
4.76 (121) |
4.29 (109) |
3.83 (97) |
5.00 (127) |
5.27 (134) |
4.59 (117) |
5.13 (130) |
57.66 (1,464) |
| Average snowfall inches (cm) | 1.0 (2.5) |
1.1 (2.8) |
0.5 (1.3) |
0.0 (0.0) |
0.0 (0.0) |
0.0 (0.0) |
0.0 (0.0) |
0.0 (0.0) |
0.0 (0.0) |
0.0 (0.0) |
0.0 (0.0) |
0.3 (0.76) |
2.9 (7.36) |
| Average precipitation days (≥ 0.01 in) | 8.6 | 9.4 | 9.6 | 8.9 | 10.2 | 8.3 | 7.3 | 7.1 | 7.1 | 8.2 | 8.5 | 8.7 | 101.9 |
| Average snowy days (≥ 0.1 in) | 0.7 | 0.9 | 0.3 | 0.0 | 0.0 | 0.0 | 0.0 | 0.0 | 0.0 | 0.0 | 0.1 | 0.4 | 2.4 |
| Source 1: NOAA[2] | |||||||||||||
| Source 2: National Weather Service[1] | |||||||||||||
References
[edit]- ^ a b "NOAA Online Weather Data – NWS Shreveport". National Weather Service. Retrieved January 24, 2024.
- ^ "U.S. Climate Normals Quick Access – Station: Battiest, OK". National Oceanic and Atmospheric Administration. Retrieved January 24, 2024.
Sources
[edit]- Shirk, George H. Oklahoma Place Names. Norman: University of Oklahoma Press, 1987. ISBN 0-8061-2028-2 .


