Fergus County | |
|---|---|
 Fergus County Courthouse in Lewistown | |
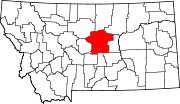
 Location within the U.S. state of Montana | |
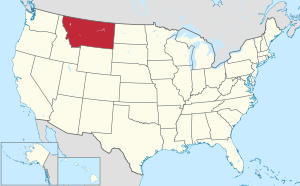
 Montana's location within the U.S. | |
| Coordinates: 47°16′N 109°13′W / 47.26°N 109.22°W | |
| Country | |
| State | |
| Founded | 1885 |
| Named for | James Fergus |
| Seat | Lewistown |
| Largest city | Lewistown |
| Area | |
• Total | 4,350 sq mi (11,300 km2) |
| • Land | 4,340 sq mi (11,200 km2) |
| • Water | 11 sq mi (30 km2) 0.2% |
| Population (2020) | |
• Total | 11,446 |
• Estimate (2022) | 11,663 |
| • Density | 2.6/sq mi (1.0/km2) |
| Time zone | UTC−7 (Mountain) |
| • Summer (DST) | UTC−6 (MDT) |
| Congressional district | 2nd |
| Website | www |
| |
Fergus County is a county in the U.S. state of Montana. As of the 2020 census, the population was 11,446.[1] Its county seat is Lewistown.[2] The county was founded in 1885 and named for James Fergus, a Montana politician who was instrumental in creating the county.[3][4]
Geography
[edit]According to the United States Census Bureau, the county has a total area of 4,350 square miles (11,300 km2), of which 4,340 square miles (11,200 km2) is land and 11 square miles (28 km2) (0.2%) is water.[5]
Adjacent counties
[edit]- Chouteau County – northwest
- Blaine County – north
- Phillips County – northeast
- Petroleum County – east
- Musselshell County – southeast
- Golden Valley County – south
- Wheatland County – southwest
- Judith Basin County – west
Major highways
[edit]National protected areas
[edit]- Charles M. Russell National Wildlife Refuge (part)
- Lewis and Clark National Forest (part)
- Upper Missouri River Breaks National Monument (part)
Military Installations
[edit]- LGM-30 Minuteman silos D-01 thru D-11 of the 10th Missile Squadron, 341st Missile Wing, 20th Air Force, assigned to Malmstrom AFB, Montana
Demographics
[edit]| Census | Pop. | Note | %± |
|---|---|---|---|
| 1890 | 3,514 | — | |
| 1900 | 6,937 | 97.4% | |
| 1910 | 17,385 | 150.6% | |
| 1920 | 28,344 | 63.0% | |
| 1930 | 16,531 | −41.7% | |
| 1940 | 14,040 | −15.1% | |
| 1950 | 14,015 | −0.2% | |
| 1960 | 14,018 | 0.0% | |
| 1970 | 12,611 | −10.0% | |
| 1980 | 13,076 | 3.7% | |
| 1990 | 12,083 | −7.6% | |
| 2000 | 11,893 | −1.6% | |
| 2010 | 11,586 | −2.6% | |
| 2020 | 11,446 | −1.2% | |
| 2022 (est.) | 11,663 | [6] | 1.9% |
| U.S. Decennial Census[7] 1790–1960[8] 1900–1990[9] 1990–2000[10] 2010–2020[1] | |||
2020 census
[edit]As of the census, of 2020, there were 11,446 people living in the county.[citation needed]
2010 census
[edit]As of the 2010 census, there were 11,586 people, 5,099 households, and 3,202 families living in the county. The population density was 2.7 inhabitants per square mile (1.0/km2). There were 5,836 housing units at an average density of 1.3 per square mile (0.50/km2). The racial makeup of the county was 96.6% white, 1.2% American Indian, 0.2% black or African American, 0.2% Asian, 0.2% from other races, and 1.5% from two or more races. Those of Hispanic or Latino origin made up 1.5% of the population. In terms of ancestry, 30.8% were German, 15.9% were English, 14.7% were Norwegian, 12.8% were Irish, and 4.2% were American.
Of the 5,099 households, 23.8% had children under the age of 18 living with them, 52.9% were married couples living together, 6.5% had a female householder with no husband present, 37.2% were non-families, and 32.6% of all households were made up of individuals. The average household size was 2.18 and the average family size was 2.75. The median age was 47.8 years.
The median income for a household in the county was $37,607 and the median income for a family was $48,623. Males had a median income of $35,110 versus $21,225 for females. The per capita income for the county was $22,295. About 12.5% of families and 14.7% of the population were below the poverty line, including 24.2% of those under age 18 and 9.3% of those age 65 or over.
Politics
[edit]Since the 1964 election, the Republican candidate has been selected in every election.
| Year | Republican | Democratic | Third party(ies) | |||
|---|---|---|---|---|---|---|
| No. | % | No. | % | No. | % | |
| 2024 | 4,965 | 73.97% | 1,522 | 22.68% | 225 | 3.35% |
| 2020 | 4,869 | 74.83% | 1,496 | 22.99% | 142 | 2.18% |
| 2016 | 4,269 | 73.10% | 1,202 | 20.58% | 369 | 6.32% |
| 2012 | 4,257 | 70.12% | 1,640 | 27.01% | 174 | 2.87% |
| 2008 | 4,108 | 65.92% | 1,933 | 31.02% | 191 | 3.06% |
| 2004 | 4,425 | 72.22% | 1,582 | 25.82% | 120 | 1.96% |
| 2000 | 4,353 | 72.62% | 1,352 | 22.56% | 289 | 4.82% |
| 1996 | 3,671 | 59.27% | 1,866 | 30.13% | 657 | 10.61% |
| 1992 | 2,736 | 42.16% | 1,615 | 24.88% | 2,139 | 32.96% |
| 1988 | 3,948 | 64.55% | 2,052 | 33.55% | 116 | 1.90% |
| 1984 | 4,585 | 70.99% | 1,804 | 27.93% | 70 | 1.08% |
| 1980 | 4,455 | 65.02% | 1,840 | 26.85% | 557 | 8.13% |
| 1976 | 3,556 | 57.73% | 2,470 | 40.10% | 134 | 2.18% |
| 1972 | 4,082 | 67.48% | 1,652 | 27.31% | 315 | 5.21% |
| 1968 | 3,367 | 55.59% | 2,070 | 34.18% | 620 | 10.24% |
| 1964 | 2,980 | 47.35% | 3,300 | 52.44% | 13 | 0.21% |
| 1960 | 3,294 | 52.24% | 2,999 | 47.56% | 13 | 0.21% |
| 1956 | 3,771 | 57.77% | 2,757 | 42.23% | 0 | 0.00% |
| 1952 | 4,402 | 65.79% | 2,271 | 33.94% | 18 | 0.27% |
| 1948 | 2,411 | 42.66% | 3,059 | 54.12% | 182 | 3.22% |
| 1944 | 2,229 | 41.11% | 3,164 | 58.35% | 29 | 0.53% |
| 1940 | 2,706 | 40.88% | 3,873 | 58.51% | 40 | 0.60% |
| 1936 | 1,821 | 27.00% | 4,675 | 69.31% | 249 | 3.69% |
| 1932 | 2,400 | 33.63% | 4,470 | 62.64% | 266 | 3.73% |
| 1928 | 4,109 | 60.09% | 2,667 | 39.00% | 62 | 0.91% |
| 1924 | 2,942 | 38.50% | 1,580 | 20.68% | 3,120 | 40.83% |
| 1920 | 5,858 | 60.22% | 3,371 | 34.66% | 498 | 5.12% |
| 1916 | 3,290 | 34.91% | 5,749 | 61.00% | 385 | 4.09% |
| 1912 | 745 | 20.34% | 1,393 | 38.03% | 1,525 | 41.63% |
| 1908 | 1,529 | 52.43% | 1,112 | 38.13% | 275 | 9.43% |
| 1904 | 1,599 | 63.23% | 780 | 30.84% | 150 | 5.93% |
| 1900 | 1,228 | 56.93% | 913 | 42.33% | 16 | 0.74% |
| 1896 | 725 | 46.41% | 834 | 53.39% | 3 | 0.19% |
| 1892 | 766 | 55.59% | 560 | 40.64% | 52 | 3.77% |
Communities
[edit]City
[edit]- Lewistown (county seat)
Towns
[edit]Unincorporated communities
[edit]Former communities
[edit]Census-designated places
[edit]Notable people
[edit]- Roy E. Ayers, member of the United States House of Representatives and 11th Governor of Montana; served as the attorney of the county from 1905 to 1909.[23]
- Carl W. Riddick, House of Representatives from the Second District of Montana, served as County Assessor of Fergus County.[24]
See also
[edit]- List of lakes in Fergus County, Montana
- List of mountains in Fergus County, Montana
- National Register of Historic Places listings in Fergus County, Montana
References
[edit]- ^ a b "State & County QuickFacts". United States Census Bureau. Retrieved April 5, 2023.
- ^ "Find a County". National Association of Counties. Archived from the original on May 31, 2011. Retrieved June 7, 2011.
- ^ "Fergus County - Home". www.co.fergus.mt.us. Archived from the original on June 23, 2018. Retrieved April 2, 2018.
- ^ Gannett, Henry (1905). The Origin of Certain Place Names in the United States. Govt. Print. Off. p. 125.
- ^ "2010 Census Gazetteer Files". United States Census Bureau. August 22, 2012. Archived from the original on December 5, 2014. Retrieved November 28, 2014.
- ^ "Annual Estimates of the Resident Population for Counties: April 1, 2020 to July 1, 2022". United States Census Bureau. Retrieved April 5, 2023.
- ^ "U.S. Decennial Census". United States Census Bureau. Retrieved November 28, 2014.
- ^ "Historical Census Browser". University of Virginia Library. Archived from the original on May 30, 2019. Retrieved November 28, 2014.
- ^ "Population of Counties by Decennial Census: 1900 to 1990". United States Census Bureau. Retrieved November 28, 2014.
- ^ "Census 2000 PHC-T-4. Ranking Tables for Counties: 1990 and 2000" (PDF). United States Census Bureau. Archived (PDF) from the original on March 27, 2010. Retrieved November 28, 2014.
- ^ Leip, David. "Atlas of US Presidential Elections". uselectionatlas.org. Retrieved April 2, 2018.
- ^ The leading "other" candidate, Progressive Theodore Roosevelt, received 1,104 votes, while Socialist candidate Eugene Debs received 421 votes.
- ^ Eddies Corner, Fergus County MT Google Maps (accessed January 1, 2019)
- ^ Giltedge, Fergus County MT Google Maps (accessed January 1, 2019)
- ^ Hanover, Fergus County MT Google Maps (accessed January 1, 2019)
- ^ Maiden, Fergus County MT Google Maps (accessed January 1, 2019)
- ^ Moore, Fergus County MT Google Maps (accessed January 1, 2019)
- ^ Piper, Fergus County MT Google Maps (accessed January 1, 2019)
- ^ Roy, Fergus County MT Google Maps (accessed January 1, 2019)
- ^ Straw, Fergus County MT Google Maps (accessed January 1, 2019)
- ^ Valentine, Fergus County MT Google Maps (accessed January 1, 2019)
- ^ Ware, Fergus County MT Google Maps (accessed January 1, 2019)
- ^ "Montana Governor Roy Elmer Ayers". National Governors Association. Retrieved October 14, 2012.
- ^ "RIDDICK, Carl Wood, (1872–1960)". Biographical Directory of the United States Congress. Retrieved October 14, 2012.
