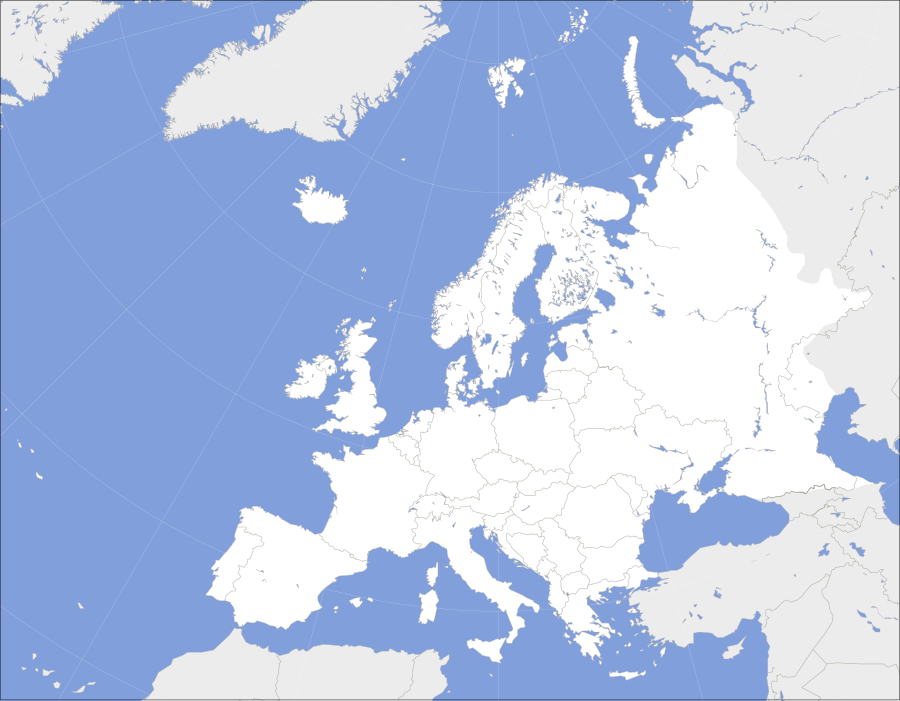
This is a list of European countries by unemployment and employment rate.
| Blue |
below 5%
|
| Green |
5.0 to 9.9%
|
| Orange |
10 to 14.9%
|
| Red |
over 15%
|

- ^ Only 51 sovereign states are listed, including Kosovo and Vatican which are not UN members
- ^ "Albania Unemployment Rate."ieconomics.com. Retrieved on January 21, 2016. "Albania - Unemployment Rate."
- ^ a b c d e f g h i j k l m n "Employment to population ratio, 15+, total (%) (national estimate) - Albania". data.worldbank.org. World Bank. Retrieved 6 May 2020.
- ^ a b c d e f g h i j k l m n o p q r s t u v w x y z aa ab "Unemployment by sex and age – monthly data". ec.europa.eu. Retrieved 2023-07-06.
- ^ a b c d e f g h i j k l m n o p q r s t u v w x y z aa ab ac ad ae af ag "Employment rate by sex, age group 20-64". ec.europa.eu/eurostat. Eurostat. Retrieved 15 December 2024.
- ^ "Unemployment in Belarus remains at 1% as of 1 January."eng.belta.by. Retrieved on January 21, 2016. "Unemployment in Belarus remains at 1% as of 1 January."
- ^ "Labour Force Survey 2018 as of April 2018 in Bosnia and Herzegovina ."bhas.ba. Retrieved on September 26, 2018. "Labour Force Survey 2018 in Bosnia and Herzegovina."
- ^ "[1]."ieconomics.com/. Kosovo Unemployment Rate
- ^ "Liechtenstein in Figures, 2019" (PDF). llv.li. Retrieved 19 August 2019.
- ^ "Moldova Unemployment Rate."statistica.md Retrieved on January 23, 2018. "Moldova - Unemployment Rate."
- ^ "Montenegro Unemployment Rate Archived 2016-01-28 at the Wayback Machine."ieconomics.com. Retrieved on January 21, 2016. "Montenegro - Unemployment Rate."
- ^ "Active population". State Statistical Office of the Republic of North Macedonia.
- ^ "Russia Unemployment Rate Archived 2016-12-04 at the Wayback Machine."ieconomics.com. Retrieved on January 21, 2016. "Russia - Unemployment Rate."
- ^ "Labour Force Survey, Q1 2020". stat.gov.rs. Retrieved 18 August 2019.
- ^ "Economically Active Population Survey. Third Quarter 2024". INE Instituto Nacional de Estadística. Retrieved 15 December 2024.
- ^ a b c "Unemployment by sex and age – monthly data". Eurostat. Retrieved 14 April 2021.
- ^ "Ukraine Unemployment Rate Archived 2016-10-09 at the Wayback Machine."ieconomics.com. Retrieved on January 21, 2016. "Ukraine - Unemployment Rate."
- ^ "Employment rate by sex, age group 20-64". ec.europa.eu/eurostat. Eurostat. Retrieved 6 May 2020.
