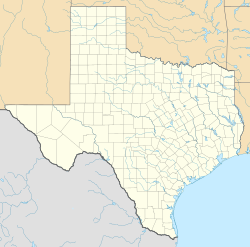
Mabelle, Texas | |
|---|---|
| Coordinates: 33°40′12″N 99°08′21″W / 33.67000°N 99.13917°W | |
| Country | United States |
| State | Texas |
| County | Baylor |
| Elevation | 1,289 ft (393 m) |
| Population (2000) | |
• Total | 9 |
| Time zone | UTC-6 (Central (CST)) |
| • Summer (DST) | UTC-5 (CDT) |
| GNIS feature ID | 1380119[1] |
Mabelle is an unincorporated community in Baylor County, Texas, United States.[1] According to the Handbook of Texas,[citation needed] the community had a population of 9 in 2000.
History
[edit]The settlement was established in 1906 as a station on the Wichita Valley line. A post office was granted on December 13 of that year and was named Mabelle for the daughter of resident J. T. Thompson. By 1920, the town had a depot, several businesses, and a Sunday school organization serving a population of 58. Mabelle continued as a small trade center despite a damaging tornado that struck the town about 1923. In 1940, the community had a post office and a few stores and reported a population of 35. The post office was discontinued about 1962. In 1980, Mabelle reported a population of ten, and in 1990 it was reported as six. By 2000, the population was reported at nine.[2]
On Monday night, April 25, 1955, after performing at the Miller Brothers' M-B Corral dancehall in Wichita Falls, Elvis Presley, bass player Bill Black, and guitarist Scotty Moore headed to another gig in Seymour, a benefit show for the local volunteer fire department. Along the way, they ran out of gas near Mabelle. After fueling up in Mabelle, Elvis and the boys arrived at the Seymour high school auditorium after most of the audience had left, but still managed to perform for the handful of people who remained.
Climate
[edit]According to the Köppen Climate Classification system, Mabelle has a humid subtropical climate, abbreviated "Cfa" on climate maps. The hottest temperature recorded in Mabelle was 115 °F (46.1 °C) on June 29, 1980 and June 29, 1994, while the coldest temperature recorded was −6 °F (−21.1 °C) on December 23–24, 1989.[3]
| Climate data for Lake Kemp, Texas, 1991–2020 normals, extremes 1962–present | |||||||||||||
|---|---|---|---|---|---|---|---|---|---|---|---|---|---|
| Month | Jan | Feb | Mar | Apr | May | Jun | Jul | Aug | Sep | Oct | Nov | Dec | Year |
| Record high °F (°C) | 87 (31) |
93 (34) |
96 (36) |
107 (42) |
113 (45) |
115 (46) |
113 (45) |
113 (45) |
111 (44) |
106 (41) |
91 (33) |
88 (31) |
115 (46) |
| Mean maximum °F (°C) | 76.7 (24.8) |
81.0 (27.2) |
87.7 (30.9) |
93.7 (34.3) |
99.5 (37.5) |
102.0 (38.9) |
106.0 (41.1) |
105.2 (40.7) |
100.8 (38.2) |
94.0 (34.4) |
83.0 (28.3) |
77.2 (25.1) |
107.8 (42.1) |
| Mean daily maximum °F (°C) | 53.7 (12.1) |
57.7 (14.3) |
66.9 (19.4) |
75.7 (24.3) |
84.1 (28.9) |
92.0 (33.3) |
96.5 (35.8) |
96.1 (35.6) |
87.7 (30.9) |
77.3 (25.2) |
64.4 (18.0) |
55.1 (12.8) |
75.6 (24.2) |
| Daily mean °F (°C) | 42.2 (5.7) |
45.8 (7.7) |
54.5 (12.5) |
63.0 (17.2) |
72.4 (22.4) |
80.7 (27.1) |
85.1 (29.5) |
84.3 (29.1) |
76.1 (24.5) |
65.3 (18.5) |
53.1 (11.7) |
44.0 (6.7) |
63.9 (17.7) |
| Mean daily minimum °F (°C) | 30.7 (−0.7) |
33.9 (1.1) |
42.1 (5.6) |
50.2 (10.1) |
60.6 (15.9) |
69.4 (20.8) |
73.6 (23.1) |
72.6 (22.6) |
64.6 (18.1) |
53.3 (11.8) |
41.8 (5.4) |
32.9 (0.5) |
52.1 (11.2) |
| Mean minimum °F (°C) | 16.9 (−8.4) |
19.6 (−6.9) |
25.7 (−3.5) |
36.1 (2.3) |
46.0 (7.8) |
60.7 (15.9) |
66.0 (18.9) |
64.2 (17.9) |
51.5 (10.8) |
37.4 (3.0) |
26.3 (−3.2) |
18.3 (−7.6) |
12.3 (−10.9) |
| Record low °F (°C) | 1 (−17) |
−4 (−20) |
9 (−13) |
27 (−3) |
33 (1) |
47 (8) |
58 (14) |
53 (12) |
36 (2) |
22 (−6) |
13 (−11) |
−6 (−21) |
−6 (−21) |
| Average precipitation inches (mm) | 1.10 (28) |
1.36 (35) |
1.81 (46) |
1.88 (48) |
3.59 (91) |
3.21 (82) |
2.14 (54) |
2.10 (53) |
2.60 (66) |
2.59 (66) |
1.57 (40) |
1.19 (30) |
25.14 (639) |
| Average snowfall inches (cm) | 0.5 (1.3) |
0.3 (0.76) |
0.0 (0.0) |
0.0 (0.0) |
0.0 (0.0) |
0.0 (0.0) |
0.0 (0.0) |
0.0 (0.0) |
0.0 (0.0) |
0.0 (0.0) |
0.7 (1.8) |
0.6 (1.5) |
2.1 (5.36) |
| Average precipitation days (≥ 0.01 in) | 3.4 | 3.7 | 4.2 | 4.6 | 6.4 | 5.6 | 4.6 | 4.3 | 4.8 | 4.8 | 3.6 | 3.3 | 53.3 |
| Average snowy days (≥ 0.1 in) | 0.3 | 0.3 | 0.0 | 0.0 | 0.0 | 0.0 | 0.0 | 0.0 | 0.0 | 0.0 | 0.2 | 0.3 | 1.1 |
| Source 1: NOAA[4] | |||||||||||||
| Source 2: National Weather Service[3] | |||||||||||||
Education
[edit]A local school originally began around 1900, and was closed in 1948 when the community's children transferred to Seymour.[2] The community continues to be served by the Seymour Independent School District today.
References
[edit]- ^ a b c U.S. Geological Survey Geographic Names Information System: Mabelle, Texas
- ^ a b "TSHA | Mabelle, TX".
- ^ a b "NOAA Online Weather Data – NWS Norman". National Weather Service. Retrieved November 30, 2023.
- ^ "U.S. Climate Normals Quick Access – Station: Lake Kemp, TX". National Oceanic and Atmospheric Administration. Retrieved November 30, 2023.


