Madison County | |
|---|---|
 Madison County Courthouse in March 2012 | |
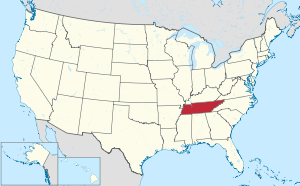
 Location within the U.S. state of Tennessee | |
 Tennessee's location within the U.S. | |
| Coordinates: 35°37′N 88°50′W / 35.61°N 88.84°W | |
| Country | |
| State | |
| Founded | 1821 |
| Named for | James Madison[1] |
| Seat | Jackson |
| Largest city | Jackson |
| Area | |
• Total | 559 sq mi (1,450 km2) |
| • Land | 557 sq mi (1,440 km2) |
| • Water | 1.5 sq mi (4 km2) 0.3% |
| Population (2020) | |
• Total | 98,823 |
| • Density | 176/sq mi (68/km2) |
| Time zone | UTC−6 (Central) |
| • Summer (DST) | UTC−5 (CDT) |
| Congressional district | 8th |
| Website | www |
Madison County is a county located in the western part of the U.S. state of Tennessee. As of the 2020 census, the population was 98,823.[2] Its county seat is Jackson.[3] Madison County is included in the Jackson, TN Metropolitan Statistical Area.
History
[edit]This section needs additional citations for verification. (October 2021) |
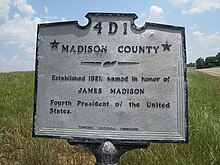
Madison County was formed in 1821, and named for founding father and president, James Madison. The county was part of lands the United States purchased from the Chickasaw in 1818.[4] After Congressional passage of the Indian Removal Act of 1830, most Chickasaw were forced out of the state and west to Indian Territory beyond the Mississippi River.[citation needed]
Pinson Mounds, one of the largest Woodland period (c. 1-500CE) mound complexes in the United States, is located in Madison County. It has the second-tallest earthwork mound in the United States.[5]
Geography
[edit]
According to the U.S. Census Bureau, the county has a total area of 559 square miles (1,450 km2), of which 557 square miles (1,440 km2) is land and 1.5 square miles (3.9 km2) (0.3%) is water.[6]
Airport
[edit]McKellar-Sipes Regional Airport (MKL) serves the county.[7][8] Lake Graham, a large 500 acre reservoir primarily intended for recreation and wildlife habitat, is located in the county 5 miles east of Jackson.[9]
Adjacent counties
[edit]- Gibson County (north)
- Carroll County (northeast)
- Henderson County (east)
- Chester County (southeast)
- Hardeman County (south)
- Haywood County (west)
- Crockett County (northwest)
State protected areas
[edit]- Pinson Mounds State Archaeological Park
- Middle Fork Bottoms State Park
- South Fork Waterfowl Refuge
- Lake Graham
Highways
[edit]Demographics
[edit]| Census | Pop. | Note | %± |
|---|---|---|---|
| 1830 | 11,594 | — | |
| 1840 | 16,530 | 42.6% | |
| 1850 | 21,470 | 29.9% | |
| 1860 | 21,535 | 0.3% | |
| 1870 | 23,480 | 9.0% | |
| 1880 | 30,874 | 31.5% | |
| 1890 | 30,497 | −1.2% | |
| 1900 | 36,333 | 19.1% | |
| 1910 | 39,357 | 8.3% | |
| 1920 | 43,824 | 11.3% | |
| 1930 | 51,059 | 16.5% | |
| 1940 | 54,115 | 6.0% | |
| 1950 | 60,128 | 11.1% | |
| 1960 | 60,655 | 0.9% | |
| 1970 | 65,727 | 8.4% | |
| 1980 | 74,546 | 13.4% | |
| 1990 | 77,982 | 4.6% | |
| 2000 | 91,837 | 17.8% | |
| 2010 | 98,294 | 7.0% | |
| 2020 | 98,823 | 0.5% | |
| U.S. Decennial Census[10] 1790–1960[11] 1900–1990[12] 1990–2000[13] 2010[14] 2020[2] | |||

2020 census
[edit]| Race | Num. | Perc. |
|---|---|---|
| White (non-Hispanic) | 53,264 | 53.9% |
| Black or African American (non-Hispanic) | 35,837 | 36.26% |
| Native American | 175 | 0.18% |
| Asian | 1,227 | 1.24% |
| Pacific Islander | 13 | 0.01% |
| Other/Mixed | 3,585 | 3.63% |
| Hispanic or Latino | 4,722 | 4.78% |
As of the 2020 United States census, there were 98,823 people, 38,930 households, and 25,748 families residing in the county.
2000 census
[edit]As of the census[18] of 2000, there were 91,837 people, 35,552 households, and 24,637 families residing in the county. The population density was 165 people per square mile (64 people/km2). There were 38,205 housing units at an average density of 69 units per square mile (27/km2). There were 35,552 households, out of which 33.50% had children under the age of 18 living with them, 49.80% were married couples living together, 15.90% had a female householder with no husband present, and 30.70% were non-families. 26.20% of all households were made up of individuals, and 9.30% had someone living alone who was 65 years of age or older. The average household size was 2.49 and the average family size was 3.00.
The racial makeup of the county was 65.20% non-Hispanic White or European American, 32.46% non-Hispanic Black or African American, 0.16% Native American, 0.63% Asian, 0.01% Pacific Islander, 0.67% from other races, and 0.86% from two or more races. 1.71% of the population were Hispanic or Latino of any race.
There were 35,552 households, out of which 33.50% had children under the age of 18 living with them, 49.80% were married couples living together, 15.90% had a female householder with no husband present, and 30.70% were non-families. 26.20% of all households were made up of individuals, and 9.30% had someone living alone who was 65 years of age or older. The average household size was 2.49 and the average family size was 3.00.
In the county, the population was spread out, with 25.80% under the age of 18, 11.00% from 18 to 24, 29.10% from 25 to 44, 21.70% from 45 to 64, and 12.30% who were 65 years of age or older. The median age was 35 years. For every 100 females, there were 92.10 males. For every 100 females age 18 and over, there were 87.20 males.
The median income for a household in the county was $36,982, and the median income for a family was $44,595. Males had a median income of $34,253 versus $23,729 for females. The per capita income for the county was $19,389. About 10.80% of families and 14.00% of the population were below the poverty line, including 18.40% of those under age 18 and 11.80% of those age 65 or over.
Government and politics
[edit]| Year | Republican | Democratic | Third party(ies) | |||
|---|---|---|---|---|---|---|
| No. | % | No. | % | No. | % | |
| 2024 | 23,385 | 58.52% | 16,115 | 40.32% | 464 | 1.16% |
| 2020 | 23,943 | 55.75% | 18,390 | 42.82% | 617 | 1.44% |
| 2016 | 21,335 | 55.97% | 15,448 | 40.52% | 1,337 | 3.51% |
| 2012 | 21,993 | 54.03% | 18,367 | 45.13% | 342 | 0.84% |
| 2008 | 23,290 | 53.12% | 20,209 | 46.09% | 347 | 0.79% |
| 2004 | 21,679 | 56.05% | 16,840 | 43.54% | 156 | 0.40% |
| 2000 | 17,862 | 52.64% | 15,781 | 46.51% | 287 | 0.85% |
| 1996 | 14,908 | 50.42% | 13,577 | 45.92% | 1,080 | 3.65% |
| 1992 | 14,869 | 47.66% | 13,629 | 43.69% | 2,698 | 8.65% |
| 1988 | 16,952 | 60.46% | 11,001 | 39.23% | 86 | 0.31% |
| 1984 | 17,819 | 59.64% | 12,006 | 40.18% | 55 | 0.18% |
| 1980 | 13,667 | 50.27% | 12,986 | 47.77% | 534 | 1.96% |
| 1976 | 11,364 | 46.08% | 12,989 | 52.67% | 306 | 1.24% |
| 1972 | 15,481 | 72.31% | 5,203 | 24.30% | 725 | 3.39% |
| 1968 | 6,143 | 29.14% | 5,517 | 26.17% | 9,420 | 44.69% |
| 1964 | 10,932 | 50.83% | 10,573 | 49.17% | 0 | 0.00% |
| 1960 | 8,863 | 50.09% | 8,083 | 45.68% | 747 | 4.22% |
| 1956 | 6,642 | 41.42% | 8,540 | 53.25% | 855 | 5.33% |
| 1952 | 7,243 | 45.50% | 8,623 | 54.17% | 53 | 0.33% |
| 1948 | 1,681 | 18.68% | 4,722 | 52.48% | 2,594 | 28.83% |
| 1944 | 1,793 | 23.85% | 5,706 | 75.91% | 18 | 0.24% |
| 1940 | 1,271 | 17.06% | 6,154 | 82.63% | 23 | 0.31% |
| 1936 | 1,223 | 16.64% | 6,095 | 82.93% | 32 | 0.44% |
| 1932 | 1,124 | 18.64% | 4,813 | 79.83% | 92 | 1.53% |
| 1928 | 1,894 | 34.64% | 3,574 | 65.36% | 0 | 0.00% |
| 1924 | 1,110 | 22.51% | 3,422 | 69.40% | 399 | 8.09% |
| 1920 | 2,665 | 33.54% | 5,280 | 66.46% | 0 | 0.00% |
| 1916 | 1,194 | 30.44% | 2,659 | 67.78% | 70 | 1.78% |
| 1912 | 1,036 | 25.06% | 2,702 | 65.36% | 396 | 9.58% |
The county is headed by an elected county mayor (currently A.J. Massey) and county commission of 25 members elected from 10 districts.[20]
Madison County was a Democratic-leaning county for the first half of the 20th century, continuing the trend until it flipped towards the Republicans in 1960. The last Democrat to carry the county was Jimmy Carter in 1976.
Healthcare
[edit]West Tennessee Healthcare (Jackson-Madison County General Hospital District), created by a law passed by the Tennessee General Assembly in 1949, serves as the public hospital system of the county. The county appoints some of the members of the board of directors.[21]
Media
[edit]This is the Madison County to which Kenny Rogers refers in his song "Reuben James".[22]
Communities
[edit]
Cities
[edit]- Humboldt (mostly in Gibson County, Tennessee)
- Jackson (county seat and largest city)
- Medon (partially in Hardeman County, Tennessee)
- Three Way
Census-Designated Places
[edit]- Mercer (partly in Haywood County, Tennessee)
Unincorporated communities
[edit]Education
[edit]Jackson-Madison County School System is the public school district.[23]
Lane College is a private historically Black college associated with the Christian Methodist Episcopal Church.
Union University is a private school affiliated with the Tennessee Baptist Convention.
West Tennessee School for the Deaf is a state-operated school in the county.
See also
[edit]References
[edit]- ^ Origins Of Tennessee County Names, Tennessee Blue Book 2005–2006, pages 508–513
- ^ a b "QuickFacts: Madison County, Tennessee; United States". United States Census Bureau. Retrieved April 13, 2021.
- ^ "Find a County". National Association of Counties. Retrieved June 7, 2011.
- ^ Harbert Alexander, "Madison County", Tennessee Encyclopedia of History and Culture; retrieved October 22, 2013.
- ^ Mark Norton, "The Pinson Mounds Complex", West Tennessee Historical Society Papers, Vol. 55 (2001). Copy obtained at Pinson Mounds State Archaeological Park.
- ^ "2010 Census Gazetteer Files". United States Census Bureau. August 22, 2012. Retrieved April 9, 2015.
- ^ Keller, Rudi (August 9, 2009). "Other cities in Great Lakes Airlines' contract find new carrier". Southeast Missourian. Retrieved November 15, 2009.
- ^ Martin, Mariann (August 31, 2009). "Nashville flights begin from McKellar-Sipes Regional Airport". The Jackson Sun. p. A1. Archived from the original on July 13, 2012. Retrieved November 15, 2009.
- ^ "Lake Graham in Tennessee". TN.gov. Tennessee Wildlife Resources Agency. Retrieved March 3, 2023.
- ^ "U.S. Decennial Census". United States Census Bureau. Retrieved April 9, 2015.
- ^ "Historical Census Browser". University of Virginia Library. Retrieved April 9, 2015.
- ^ Forstall, Richard L., ed. (March 27, 1995). "Population of Counties by Decennial Census: 1900 to 1990". United States Census Bureau. Retrieved April 9, 2015.
- ^ "Census 2000 PHC-T-4. Ranking Tables for Counties: 1990 and 2000" (PDF). United States Census Bureau. April 2, 2001. Archived (PDF) from the original on October 9, 2022. Retrieved April 9, 2015.
- ^ "State & County QuickFacts". United States Census Bureau. Archived from the original on June 7, 2011. Retrieved December 6, 2013.
- ^ "Population and Housing Unit Estimates". Retrieved July 20, 2019.
- ^ Based on 2000 census data
- ^ "Explore Census Data". data.census.gov. Retrieved December 8, 2021.
- ^ "U.S. Census website". United States Census Bureau. Retrieved May 14, 2011.
- ^ Leip, David. "Dave Leip's Atlas of U.S. Presidential Elections". uselectionatlas.org. Retrieved March 11, 2018.
- ^ "Madison County, TN - Official Website". co,madison.tn.us. Madison County, Tennessee. Archived from the original on July 30, 2014.
- ^ "About Us". West Tennessee Healthcare. Retrieved December 2, 2021.
- ^ "65: Reuben James | Chicken Soup for the Soul". chickensoup.com. July 2, 2014. Retrieved March 11, 2018.
- ^ "2020 CENSUS - SCHOOL DISTRICT REFERENCE MAP: Madison County, TN" (PDF). U.S. Census Bureau. Archived (PDF) from the original on October 9, 2022. Retrieved July 23, 2022. - Text list
External links
[edit]- Madison County official website
- Madison County, TNGenWeb – free genealogy resources for the county
