| Mount Powell | |
|---|---|
 Southwest aspect, from Beaver Creek Ski Resort (Eagles Nest to left) | |
| Highest point | |
| Elevation | 13,586 ft (4,141 m)[1][2] |
| Prominence | 3,000 ft (914 m)[2] |
| Isolation | 21.50 mi (34.60 km)[2] |
| Listing | |
| Coordinates | 39°45′36″N 106°20′27″W / 39.759991°N 106.340704°W[3] |
| Naming | |
| Etymology | John Wesley Powell |
| Geography | |
| Location | Eagle and Summit counties, Colorado, United States[3] |
| Parent range | Highest summit of the Gore Range[2] |
| Topo map(s) | USGS 7.5' topographic map Mount Powell, Colorado[3] |
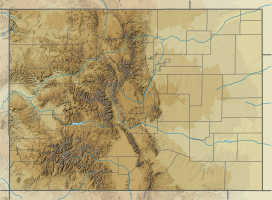
Mount Powell is the highest summit of the Gore Range in the Rocky Mountains of North America. The prominent 13,586-foot (4,141 m) thirteener is located in the Eagles Nest Wilderness, 8.5 miles (13.7 km) north by east (bearing 8°) of the Town of Vail, Colorado, United States, along the drainage divide separating White River National Forest and Eagle County from Arapaho National Forest and Summit County.[1][2][3] Mount Powell was named in honor of John Wesley Powell who climbed to the summit in 1868.[3]
Mountain
[edit]Mount Powell is very prominent when viewed from the north east, rising 6,000 feet above Green Mountain Reservoir.
Climate
[edit]| Climate data for Mount Powell 39.7597 N, 106.3412 W, Elevation: 13,114 ft (3,997 m) (1991–2020 normals) | |||||||||||||
|---|---|---|---|---|---|---|---|---|---|---|---|---|---|
| Month | Jan | Feb | Mar | Apr | May | Jun | Jul | Aug | Sep | Oct | Nov | Dec | Year |
| Mean daily maximum °F (°C) | 21.3 (−5.9) |
20.8 (−6.2) |
26.5 (−3.1) |
32.8 (0.4) |
41.4 (5.2) |
52.4 (11.3) |
59.2 (15.1) |
56.4 (13.6) |
49.9 (9.9) |
38.2 (3.4) |
27.7 (−2.4) |
21.4 (−5.9) |
37.3 (2.9) |
| Daily mean °F (°C) | 10.3 (−12.1) |
9.5 (−12.5) |
14.5 (−9.7) |
20.1 (−6.6) |
28.9 (−1.7) |
39.2 (4.0) |
45.8 (7.7) |
43.8 (6.6) |
37.3 (2.9) |
26.7 (−2.9) |
17.3 (−8.2) |
10.8 (−11.8) |
25.4 (−3.7) |
| Mean daily minimum °F (°C) | −0.7 (−18.2) |
−1.9 (−18.8) |
2.5 (−16.4) |
7.4 (−13.7) |
16.4 (−8.7) |
26.0 (−3.3) |
32.5 (0.3) |
31.2 (−0.4) |
24.7 (−4.1) |
15.2 (−9.3) |
6.8 (−14.0) |
0.1 (−17.7) |
13.4 (−10.4) |
| Average precipitation inches (mm) | 3.93 (100) |
4.16 (106) |
4.51 (115) |
5.51 (140) |
3.57 (91) |
1.59 (40) |
2.08 (53) |
2.08 (53) |
2.47 (63) |
3.48 (88) |
3.84 (98) |
4.09 (104) |
41.31 (1,051) |
| Source: PRISM Climate Group[4] | |||||||||||||
See also
[edit]Further reading
[edit]- Mike Garratt, Bob Martin, Colorado's High Thirteeners: A Climbing and Hiking Guide, PP 3-4
- Randy Jacobs, Robert M. Ormes, Guide to the Colorado Mountains, P 143
References
[edit]- ^ a b The elevation of Mount Powell includes an adjustment of +1.771 m (+5.81 ft) from NGVD 29 to NAVD 88.
- ^ a b c d e "Mount Powell, Colorado". Peakbagger.com. Retrieved October 21, 2014.
- ^ a b c d e "Mount Powell". Geographic Names Information System. United States Geological Survey, United States Department of the Interior. Retrieved October 21, 2014.
- ^ "PRISM Climate Group, Oregon State University". PRISM Climate Group, Oregon State University. Retrieved October 10, 2023.
To find the table data on the PRISM website, start by clicking Coordinates (under Location); copy Latitude and Longitude figures from top of table; click Zoom to location; click Precipitation, Minimum temp, Mean temp, Maximum temp; click 30-year normals, 1991-2020; click 800m; click Retrieve Time Series button.
