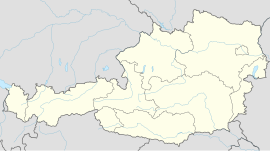
Rinn | |
|---|---|
 | |
| Coordinates: 47°14′58″N 11°30′13″E / 47.24944°N 11.50361°E | |
| Country | Austria |
| State | Tyrol |
| District | Innsbruck Land |
| Government | |
| • Mayor | Friedl Hoppichler |
| Area | |
| • Total | 10.65 km2 (4.11 sq mi) |
| Elevation | 918 m (3,012 ft) |
| Population (2018-01-01)[2] | |
| • Total | 1,877 |
| • Density | 180/km2 (460/sq mi) |
| Time zone | UTC+1 (CET) |
| • Summer (DST) | UTC+2 (CEST) |
| Postal code | 6074 |
| Area code | 05223 |
| Vehicle registration | IL |
| Website | www.rinn.tirol.gv.at |
Rinn is a municipality in the district of Innsbruck-Land in the Austrian state of Tyrol located 6 km southeast of Innsbruck. The village was mentioned in documents as “Runne” in 1250 for the first time.
Population
[edit]| Year | Pop. | ±% |
|---|---|---|
| 1869 | 321 | — |
| 1880 | 313 | −2.5% |
| 1890 | 312 | −0.3% |
| 1900 | 358 | +14.7% |
| 1910 | 386 | +7.8% |
| 1923 | 469 | +21.5% |
| 1934 | 470 | +0.2% |
| 1939 | 432 | −8.1% |
| 1951 | 598 | +38.4% |
| 1961 | 611 | +2.2% |
| 1971 | 682 | +11.6% |
| 1981 | 937 | +37.4% |
| 1991 | 1,142 | +21.9% |
| 2001 | 1,430 | +25.2% |
| 2011 | 1,655 | +15.7% |
Climate
[edit]Climate type is dominated by the winter season, a long, cold period with short, clear days, relatively little precipitation mostly in the form of snow, and low humidity. The Köppen Climate Classification subtype for this climate is "Dfb" (humid continental climate).[3]
| Climate data for Rinn (1971–2000) | |||||||||||||
|---|---|---|---|---|---|---|---|---|---|---|---|---|---|
| Month | Jan | Feb | Mar | Apr | May | Jun | Jul | Aug | Sep | Oct | Nov | Dec | Year |
| Record high °C (°F) | 16.2 (61.2) |
17.0 (62.6) |
21.1 (70.0) |
24.5 (76.1) |
28.0 (82.4) |
30.5 (86.9) |
33.5 (92.3) |
32.0 (89.6) |
30.5 (86.9) |
23.1 (73.6) |
19.0 (66.2) |
16.2 (61.2) |
33.5 (92.3) |
| Mean daily maximum °C (°F) | 2.2 (36.0) |
3.9 (39.0) |
8.1 (46.6) |
11.7 (53.1) |
17.1 (62.8) |
19.5 (67.1) |
21.7 (71.1) |
21.3 (70.3) |
17.8 (64.0) |
13.1 (55.6) |
5.9 (42.6) |
2.5 (36.5) |
12.1 (53.8) |
| Daily mean °C (°F) | −2.1 (28.2) |
−1.2 (29.8) |
2.4 (36.3) |
5.9 (42.6) |
11.1 (52.0) |
13.6 (56.5) |
15.7 (60.3) |
15.1 (59.2) |
11.6 (52.9) |
7.3 (45.1) |
1.5 (34.7) |
−1.5 (29.3) |
6.6 (43.9) |
| Mean daily minimum °C (°F) | −5.4 (22.3) |
−4.6 (23.7) |
−1.5 (29.3) |
1.4 (34.5) |
5.8 (42.4) |
8.4 (47.1) |
10.4 (50.7) |
10.3 (50.5) |
7.4 (45.3) |
3.6 (38.5) |
−1.5 (29.3) |
−4.5 (23.9) |
2.5 (36.5) |
| Record low °C (°F) | −24.0 (−11.2) |
−18.0 (−0.4) |
−19.4 (−2.9) |
−7.4 (18.7) |
−5.5 (22.1) |
0.2 (32.4) |
1.6 (34.9) |
1.0 (33.8) |
−2.7 (27.1) |
−8.0 (17.6) |
−16.3 (2.7) |
−21.0 (−5.8) |
−24.0 (−11.2) |
| Average precipitation mm (inches) | 31.1 (1.22) |
31.0 (1.22) |
48.4 (1.91) |
56.8 (2.24) |
82.0 (3.23) |
113.4 (4.46) |
128.0 (5.04) |
110.1 (4.33) |
79.9 (3.15) |
53.2 (2.09) |
52.9 (2.08) |
42.9 (1.69) |
829.7 (32.67) |
| Average snowfall cm (inches) | 18.6 (7.3) |
20.3 (8.0) |
17.9 (7.0) |
9.7 (3.8) |
1.5 (0.6) |
0.0 (0.0) |
0.0 (0.0) |
0.0 (0.0) |
0.0 (0.0) |
1.4 (0.6) |
14.8 (5.8) |
20.3 (8.0) |
104.5 (41.1) |
| Average precipitation days (≥ 1.0 mm) | 6.4 | 5.9 | 8.0 | 9.0 | 10.1 | 13.3 | 12.9 | 12.6 | 8.4 | 7.0 | 7.8 | 7.8 | 109.2 |
| Average relative humidity (%) (at 14:00) | 66.1 | 60.4 | 54.2 | 50.7 | 50.3 | 54.4 | 55.6 | 57.2 | 57.9 | 60.6 | 70.9 | 73.2 | 59.3 |
| Mean monthly sunshine hours | 70.2 | 110.2 | 151.7 | 164.7 | 203.6 | 191.0 | 228.9 | 219.0 | 183.9 | 153.0 | 83.6 | 51.1 | 1,810.9 |
| Percent possible sunshine | 44.4 | 54.0 | 48.5 | 45.0 | 49.2 | 44.6 | 54.0 | 55.2 | 56.5 | 56.6 | 47.2 | 44.1 | 49.9 |
| Source: Central Institute for Meteorology and Geodynamics[4] | |||||||||||||
References
[edit]- ^ "Dauersiedlungsraum der Gemeinden Politischen Bezirke und Bundesländer - Gebietsstand 1.1.2018". Statistics Austria. Retrieved 10 March 2019.
- ^ "Einwohnerzahl 1.1.2018 nach Gemeinden mit Status, Gebietsstand 1.1.2018". Statistics Austria. Retrieved 9 March 2019.
- ^ Climate Summary for Rinn
- ^ "Klimadaten von Österreich 1971–2000 – Tirol-Rinn" (in German). Central Institute for Meteorology and Geodynamics. Archived from the original on 12 October 2019. Retrieved 3 November 2019.
External links
[edit]Wikimedia Commons has media related to Rinn.

