| Wyoming Peak | |
|---|---|
 Wyoming Peak (center background) from Middle Piney Lake, with Mount Coffin at right | |
| Highest point | |
| Elevation | 11,383 ft (3,470 m)[1] |
| Prominence | 3,538 ft (1,078 m)[1] |
| Coordinates | 42°36′16″N 110°37′28″W / 42.60444°N 110.62444°W[2] |
| Geography | |
| Location | Lincoln County, Wyoming, U.S. |
| Parent range | Wyoming Range |
| Topo map | USGS Wyoming Peak |
| Climbing | |
| Easiest route | Hike |
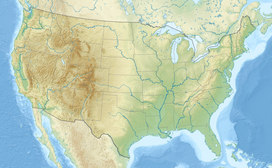
Wyoming Peak (11,383 feet (3,470 m)) is the tallest mountain in the Wyoming Range in the U.S. state of Wyoming.[3] Situated in Bridger-Teton National Forest, a now collapsed fire lookout is located on the summit.[4] Wyoming Peak is .75 miles (1.21 km) south-southeast of Coffin Peak, the second highest peak in the Wyoming Range.[5]
Climate
[edit]There is no weather station at the summit, but this climate table contains interpolated data for an area around the summit. Wyoming Peak has a (subalpine climate (Köppen Dfc).
| Climate data for Wyoming Peak 42.6185 N, 110.6250 W, Elevation: 10,925 ft (3,330 m) (1991–2020 normals) | |||||||||||||
|---|---|---|---|---|---|---|---|---|---|---|---|---|---|
| Month | Jan | Feb | Mar | Apr | May | Jun | Jul | Aug | Sep | Oct | Nov | Dec | Year |
| Mean daily maximum °F (°C) | 23.9 (−4.5) |
23.7 (−4.6) |
29.3 (−1.5) |
34.6 (1.4) |
43.9 (6.6) |
55.0 (12.8) |
65.1 (18.4) |
63.6 (17.6) |
54.0 (12.2) |
40.6 (4.8) |
29.7 (−1.3) |
23.2 (−4.9) |
40.6 (4.8) |
| Daily mean °F (°C) | 14.5 (−9.7) |
13.5 (−10.3) |
18.4 (−7.6) |
23.3 (−4.8) |
32.3 (0.2) |
42.6 (5.9) |
51.6 (10.9) |
50.5 (10.3) |
41.7 (5.4) |
29.9 (−1.2) |
20.3 (−6.5) |
14.1 (−9.9) |
29.4 (−1.4) |
| Mean daily minimum °F (°C) | 5.0 (−15.0) |
3.2 (−16.0) |
7.6 (−13.6) |
11.9 (−11.2) |
20.7 (−6.3) |
30.2 (−1.0) |
38.2 (3.4) |
37.3 (2.9) |
29.3 (−1.5) |
19.3 (−7.1) |
11.0 (−11.7) |
5.0 (−15.0) |
18.2 (−7.7) |
| Average precipitation inches (mm) | 6.31 (160) |
5.64 (143) |
4.61 (117) |
4.19 (106) |
3.69 (94) |
2.38 (60) |
1.49 (38) |
1.49 (38) |
2.16 (55) |
2.97 (75) |
4.86 (123) |
5.84 (148) |
45.63 (1,157) |
| Source: PRISM Climate Group[6] | |||||||||||||
References
[edit]- ^ a b "Wyoming Peak, Wyoming". Peakbagger.com. Retrieved March 31, 2016.
- ^ "Wyoming Peak". Geographic Names Information System. United States Geological Survey, United States Department of the Interior. Retrieved March 31, 2016.
- ^ Wyoming Peak, WY (Map). TopoQwest (United States Geological Survey Maps). Retrieved March 31, 2016.
- ^ "Wyoming Peak Collapsed Lookout". Pinedale Online/Dave Bell. June 30, 2012. Retrieved March 31, 2016.
- ^ "Wyoming Range". Peakbagger.com. Retrieved March 31, 2016.
- ^ "PRISM Climate Group, Oregon State University". PRISM Climate Group, Oregon State University. Retrieved October 6, 2023.
To find the table data on the PRISM website, start by clicking Coordinates (under Location); copy Latitude and Longitude figures from top of table; click Zoom to location; click Precipitation, Minimum temp, Mean temp, Maximum temp; click 30-year normals, 1991-2020; click 800m; click Retrieve Time Series button.

