| ||||||||||||||||||||||||||
| ||||||||||||||||||||||||||
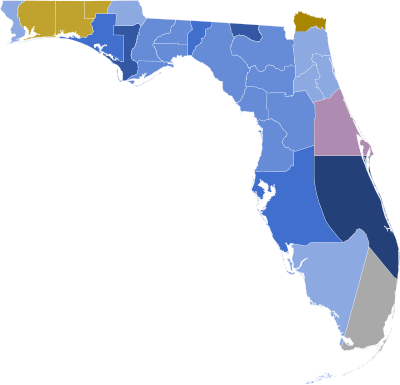
 County Results
| ||||||||||||||||||||||||||
| ||||||||||||||||||||||||||
The 1852 United States presidential election in Florida took place on November 2, 1852, as part of the 1852 United States presidential election. Voters chose three representatives, or electors to the Electoral College, who voted for President and Vice President.
Results
[edit]Democrat Franklin Pierce defeated Whig Party candidate Winfield Scott by a margin of 20.06% or 1,443 votes. Pierce won all of Florida's 3 electoral votes and was the first Democrat to win the state.
| Party | Candidate | Votes | % | |
|---|---|---|---|---|
| Democratic | Franklin Pierce | 4,318 | 60.03% | |
| Whig | Winfield Scott | 2,875 | 39.97% | |
| Total votes | 7,193 | 100% | ||
Results by County
[edit]| County[2] | Franklin Pierce Democratic |
Winfield Scott Whig |
Total votes | ||
|---|---|---|---|---|---|
| # | % | # | % | ||
| Alachua | 209 | 65.3% | 111 | 34.7% | 320 |
| Calhoun | 61 | 82.4% | 13 | 17.6% | 74 |
| Columbia | 337 | 63.1% | 197 | 36.9% | 534 |
| Dade* | 0% | 0 | 0% | 0 | 0 |
| Duval | 314 | 53.4% | 274 | 46.6% | 588 |
| Escambia | 213 | 51.3% | 202 | 48.7% | 415 |
| Franklin | 173 | 66.5% | 87 | 33.5% | 260 |
| Gadsden | 306 | 64.3% | 170 | 35.7% | 476 |
| Hamilton | 117 | 81.3% | 27 | 18.7% | 144 |
| Hernando | 93 | 66.4% | 47 | 33.6% | 140 |
| Hillsborough | 165 | 70.2% | 70 | 29.8% | 235 |
| Holmes | 59 | 44.7% | 73 | 55.3% | 132 |
| Jackson | 261 | 50.1% | 260 | 49.9% | 521 |
| Jefferson | 320 | 79.0% | 85 | 21.0% | 405 |
| Leon | 384 | 62.8% | 227 | 37.2% | 611 |
| Levy | 43 | 61.4% | 27 | 38.6% | 70 |
| Madison | 183 | 64.4% | 101 | 35.6% | 284 |
| Marion | 206 | 60.1% | 137 | 39.9% | 343 |
| Monroe | 116 | 55.0% | 95 | 45.0% | 211 |
| Nassau | 29 | 37.7% | 48 | 62.3% | 77 |
| Orange | 35 | 50.0% | 35 | 50.0% | 70 |
| Putnam | 47 | 56.0% | 37 | 44.0% | 84 |
| Santa Rosa | 159 | 42.2% | 218 | 57.8% | 377 |
| St. Johns | 140 | 59.1% | 97 | 40.9% | 237 |
| St. Lucie | 7 | 100% | 0 | 0% | 7 |
| Wakulla | 154 | 63.1% | 90 | 36.9% | 244 |
| Walton | 78 | 40.8% | 113 | 59.2% | 191 |
| Washington | 109 | 76.2% | 34 | 23.8% | 143 |
| Totals | 4,318 | 60.0% | 2,845 | 40.0% | 7,193 |
| *Dade County had no returns. | |||||
See also
[edit]References
[edit]- ^ "1852 Presidential General Election Results - Florida". US Election Atlas.
- ^ Dubin, Michael J. (1998). United States Presidential Elections, 1788-1860: The Official Results by County and State. McFarland & Company. p. 117.
| Elections in Florida |
|---|
 |
|
|


