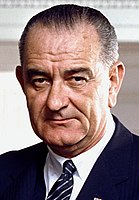
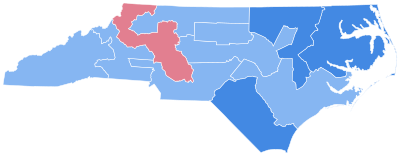
The 1964 United States presidential election in North Carolina took place on November 3, 1964, and was part of the 1964 United States presidential election . Voters chose 13 representatives, or electors, to the Electoral College , who voted for president and vice president .
Polling initially showed Goldwater leading in North Carolina, but his farm policies, particularly his opposition to federal tobacco price support, hurt his campaign.
As of the 2020 presidential election [update] Wayne , Moore , and Lenoir .[ 2]
County[ 4]
Lyndon B. Johnson
Barry Goldwater[ 5]
Margin
Total
#
%
#
%
#
%
Alamance
15,397
50.36%
15,177
49.64%
220
0.72%
30,574
Alexander
3,722
49.75%
3,760
50.25%
−38
−0.50%
7,482
Alleghany
2,368
60.09%
1,573
39.91%
795
20.18%
3,941
Anson
4,144
70.66%
1,721
29.34%
2,423
41.32%
5,865
Ashe
4,965
54.23%
4,191
45.77%
774
8.45%
9,156
Avery
1,523
36.44%
2,656
63.56%
−1,133
−27.12%
4,179
Beaufort
6,090
62.88%
3,595
37.12%
2,495
25.76%
9,685
Bertie
3,332
78.16%
931
21.84%
2,401
56.32%
4,263
Bladen
4,516
67.55%
2,169
32.45%
2,347
35.10%
6,685
Brunswick
4,240
53.26%
3,721
46.74%
519
6.52%
7,961
Buncombe
31,623
62.01%
19,372
37.99%
12,251
24.02%
50,995
Burke
12,815
55.97%
10,081
44.03%
2,734
11.94%
22,896
Cabarrus
11,921
47.50%
13,178
52.50%
−1,257
−5.00%
25,099
Caldwell
10,846
55.40%
8,733
44.60%
2,113
10.80%
19,579
Camden
870
61.97%
534
38.03%
336
23.94%
1,404
Carteret
6,231
59.23%
4,289
40.77%
1,942
18.46%
10,520
Caswell
2,513
58.36%
1,793
41.64%
720
16.72%
4,306
Catawba
15,814
48.02%
17,116
51.98%
−1,302
−3.96%
32,930
Chatham
5,295
56.29%
4,111
43.71%
1,184
12.58%
9,406
Cherokee
3,823
55.17%
3,106
44.83%
717
10.35%
6,929
Chowan
1,696
68.30%
787
31.70%
909
36.60%
2,483
Clay
1,457
53.12%
1,286
46.88%
171
6.24%
2,743
Cleveland
10,836
57.92%
7,874
42.08%
2,962
15.84%
18,710
Columbus
9,004
66.82%
4,471
33.18%
4,533
33.64%
13,475
Craven
7,422
61.27%
4,691
38.73%
2,731
22.54%
12,113
Cumberland
13,864
60.39%
9,093
39.61%
4,771
20.78%
22,957
Currituck
1,455
66.26%
741
33.74%
714
32.52%
2,196
Dare
1,476
63.00%
867
37.00%
609
26.00%
2,343
Davidson
13,735
44.27%
17,292
55.73%
−3,557
−11.46%
31,027
Davie
3,086
40.90%
4,460
59.10%
−1,374
−18.20%
7,546
Duplin
7,169
65.23%
3,821
34.77%
3,348
30.46%
10,990
Durham
22,874
59.98%
15,264
40.02%
7,610
19.96%
38,138
Edgecombe
7,834
66.58%
3,932
33.42%
3,902
33.16%
11,766
Forsyth
31,615
51.08%
30,276
48.92%
1,339
2.16%
61,891
Franklin
4,554
68.47%
2,097
31.53%
2,457
36.94%
6,651
Gaston
20,197
54.11%
17,129
45.89%
3,068
8.22%
37,326
Gates
1,702
75.38%
556
24.62%
1,146
50.76%
2,258
Graham
1,737
55.41%
1,398
44.59%
339
10.82%
3,135
Granville
4,596
63.66%
2,624
36.34%
1,972
27.32%
7,220
Greene
2,712
75.06%
901
24.94%
1,811
50.12%
3,613
Guilford
39,969
52.87%
35,635
47.13%
4,334
5.74%
75,604
Halifax
8,952
65.30%
4,757
34.70%
4,195
30.60%
13,709
Harnett
7,477
55.97%
5,883
44.03%
1,594
11.94%
13,360
Haywood
10,664
65.67%
5,575
34.33%
5,089
31.34%
16,239
Henderson
6,066
40.86%
8,780
59.14%
−2,714
−18.28%
14,846
Hertford
3,953
79.91%
994
20.09%
2,959
59.82%
4,947
Hoke
2,254
74.32%
779
25.68%
1,475
48.64%
3,033
Hyde
1,127
68.68%
514
31.32%
613
37.36%
1,641
Iredell
11,231
46.56%
12,892
53.44%
−1,661
−6.88%
24,123
Jackson
4,905
60.65%
3,183
39.35%
1,722
21.30%
8,088
Johnston
10,326
57.85%
7,523
42.15%
2,803
15.70%
17,849
Jones
2,129
73.29%
776
26.71%
1,353
46.58%
2,905
Lee
4,730
63.21%
2,753
36.79%
1,977
26.42%
7,483
Lenoir
7,617
57.56%
5,617
42.44%
2,000
15.12%
13,234
Lincoln
7,304
55.45%
5,869
44.55%
1,435
10.90%
13,173
Macon
3,774
56.55%
2,900
43.45%
874
13.10%
6,674
Madison
3,829
53.44%
3,336
46.56%
493
6.88%
7,165
Martin
4,821
76.14%
1,511
23.86%
3,310
52.28%
6,332
McDowell
6,314
60.20%
4,174
39.80%
2,140
20.40%
10,488
Mecklenburg
49,582
51.56%
46,589
48.44%
2,993
3.12%
96,171
Mitchell
1,736
34.73%
3,263
65.27%
−1,527
−30.54%
4,999
Montgomery
3,933
53.74%
3,385
46.26%
548
7.48%
7,318
Moore
6,384
55.29%
5,162
44.71%
1,222
10.58%
11,546
Nash
9,163
58.89%
6,396
41.11%
2,767
17.78%
15,559
New Hanover
12,584
50.90%
12,140
49.10%
444
1.80%
24,724
Northampton
5,046
80.96%
1,187
19.04%
3,859
61.92%
6,233
Onslow
5,955
61.23%
3,771
38.77%
2,184
22.46%
9,726
Orange
9,206
61.41%
5,785
38.59%
3,421
22.82%
14,991
Pamlico
1,864
64.28%
1,036
35.72%
828
28.55%
2,900
Pasquotank
4,269
64.21%
2,380
35.79%
1,889
28.42%
6,649
Pender
3,205
62.04%
1,961
37.96%
1,244
24.08%
5,166
Perquimans
1,458
60.78%
941
39.22%
517
21.56%
2,399
Person
4,740
68.68%
2,162
31.32%
2,578
37.36%
6,902
Pitt
11,317
68.73%
5,149
31.27%
6,168
37.46%
16,466
Polk
3,017
52.18%
2,765
47.82%
252
4.36%
5,782
Randolph
10,638
43.64%
13,739
56.36%
−3,101
−12.72%
24,377
Richmond
8,516
73.17%
3,123
26.83%
5,393
46.34%
11,639
Robeson
13,796
79.35%
3,591
20.65%
10,205
58.70%
17,387
Rockingham
11,432
55.78%
9,063
44.22%
2,369
11.56%
20,495
Rowan
14,934
50.22%
14,804
49.78%
130
0.44%
29,738
Rutherford
9,541
57.28%
7,115
42.72%
2,426
14.56%
16,656
Sampson
8,067
51.38%
7,634
48.62%
433
2.76%
15,701
Scotland
3,844
75.77%
1,229
24.23%
2,615
51.54%
5,073
Stanly
7,931
47.05%
8,924
52.95%
−993
−5.90%
16,855
Stokes
4,898
51.22%
4,664
48.78%
234
2.44%
9,562
Surry
9,810
55.17%
7,970
44.83%
1,840
10.34%
17,780
Swain
2,294
59.93%
1,534
40.07%
760
19.86%
3,828
Transylvania
4,483
55.83%
3,547
44.17%
936
11.66%
8,030
Tyrrell
996
72.70%
374
27.30%
622
45.40%
1,370
Union
7,208
63.02%
4,229
36.98%
2,979
26.04%
11,437
Vance
5,186
60.04%
3,452
39.96%
1,734
20.08%
8,638
Wake
31,653
58.41%
22,542
41.59%
9,111
16.82%
54,195
Warren
2,849
59.88%
1,909
40.12%
940
19.76%
4,758
Washington
2,505
68.65%
1,144
31.35%
1,361
37.30%
3,649
Watauga
4,031
50.62%
3,932
49.38%
99
1.24%
7,963
Wayne
9,791
56.45%
7,555
43.55%
2,236
12.90%
17,346
Wilkes
9,176
45.45%
11,014
54.55%
−1,838
−9.10%
20,190
Wilson
7,238
59.13%
5,002
40.87%
2,236
18.26%
12,240
Yadkin
3,638
38.30%
5,860
61.70%
−2,222
−23.40%
9,498
Yancey
3,714
64.95%
2,004
35.05%
1,710
29.90%
5,718
Totals
800,139
56.15%
624,844
43.85%
175,295
12.30%
1,424,983


