| |||||||||||||||||||||||||||||||||||||||||||||||||
All 89 seats in the Legislative Assembly of Queensland 45 Assembly seats were needed for a majority | |||||||||||||||||||||||||||||||||||||||||||||||||
|---|---|---|---|---|---|---|---|---|---|---|---|---|---|---|---|---|---|---|---|---|---|---|---|---|---|---|---|---|---|---|---|---|---|---|---|---|---|---|---|---|---|---|---|---|---|---|---|---|---|
| Registered | 2,400,977 | ||||||||||||||||||||||||||||||||||||||||||||||||
| Turnout | 2,195,400 (91.44%)[1] ( | ||||||||||||||||||||||||||||||||||||||||||||||||
| |||||||||||||||||||||||||||||||||||||||||||||||||
 The top map shows the first party preference by electorate. The bottom map shows the final two-party preferred vote result by electorate. | |||||||||||||||||||||||||||||||||||||||||||||||||
| |||||||||||||||||||||||||||||||||||||||||||||||||
The 2004 Queensland state election was held on 7 February 2004 to elect all 89 members of the state's Legislative Assembly.
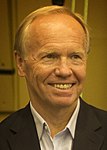
The Labor Party (ALP) government of premier Peter Beattie won a third term in office, with its large majority almost untouched.
Key dates
[edit]| Date | Event |
|---|---|
| 13 January 2004 | Writs were issued by the Governor to proceed with an election.[2] |
| 19 January 2004 | Close of electoral rolls. |
| 20 January 2004 | Close of nominations. |
| 7 February 2004 | Polling day, between the hours of 8am and 6pm. |
| 12 February 2004 | The Beattie Ministry was reconstituted. |
| 20 February 2004 | The writ was returned and the results formally declared. |
Retiring members
[edit]Labor
[edit]- Steve Bredhauer (Cook)
- Wendy Edmond (Mount Coot-tha)
- Matt Foley (Yeerongpilly)
- Anita Phillips (Thuringowa)
Liberal
[edit]National
[edit]Results
[edit] | ||||||
|---|---|---|---|---|---|---|
| Party | Votes | % | +/– | Seats | +/– | |
| Labor | 1,011,630 | 47.01 | 63 | |||
| Liberal | 398,147 | 18.50 | 5 | |||
| National | 365,005 | 16.96 | 15 | |||
| Greens | 145,522 | 6.76 | 0 | |||
| Independents | 125,516 | 5.83 | 5 | |||
| One Nation | 104,980 | 4.88 | 1 | |||
| Democrats | 943 | 0.04 | 0 | |||
| Total | 2,151,743 | 100.00 | – | 89 | – | |
| Valid votes | 2,151,743 | 98.01 | ||||
| Invalid/blank votes | 43,657 | 1.99 | ||||
| Total votes | 2,195,400 | 100.00 | – | |||
| Registered voters/turnout | 2,400,977 | 91.44 | ||||
| Source: [3] | ||||||
Seats changing hands
[edit]| Seat | 2001 Election | Swing | 2004 Election | ||||||
| Party | Member | Margin | Margin | Member | Party | ||||
| Burdekin | Labor | Steve Rodgers | 5.13 | -9.51 | 4.39 | Rosemary Menkens | National | ||
| Burnett | Labor | Trevor Strong | 1.70 | -4.26 | 2.56 | Rob Messenger | National | ||
| Charters Towers | Labor | Christine Scott | 2.17 | -4.89 | 2.7 | Shane Knuth | National | ||
| Currumbin | Labor | Merri Rose | 14.55 | -17.78 | 3.23 | Jann Stuckey | Liberal | ||
| Gympie | One Nation | Elisa Roberts¹ | 3.26 | -13.32 | 10.05 | Elisa Roberts | Independent | ||
| Keppel | National | Vince Lester | 1.46 | -5.23 | 3.78 | Paul Hoolihan | Labor | ||
| Lockyer | One Nation | Bill Flynn | 7.30 | -11.42 | 4.12 | Ian Rickuss | National | ||
| Surfers Paradise | Independent | Lex Bell² | 8.12 | -22.02 | 13.91 | John-Paul Langbroek | Liberal | ||
- Members listed in italics did not contest their seat at this election.
- ¹ Elisa Roberts resigned from the One Nation Party and contested the election as an Independent.
- ² Lex Bell won Surfers Paradise as an Independent at the 2001 by-election. The National Party had retained the seat at the 2001 election.
Post-election pendulum
[edit]Subsequent changes
[edit]- On 21 July 2005, Labor Speaker of the Legislative Assembly Ray Hollis (Redcliffe) resigned. At the by-election on 20 August 2005, Terry Rogers gained the seat for the Liberal Party.
- On 25 July 2005, Labor Deputy Premier Terry Mackenroth (Chatsworth) resigned. At the by-election on 20 August 2005, Michael Caltabiano gained the seat for the Liberal Party.
- On 28 February 2006, Labor Party member Robert Poole (Gaven) resigned. At the by-election on 1 April 2006, Alex Douglas gained the seat for the National Party.
- On 21 August 2006, Cate Molloy (Noosa) resigned from the Labor Party and sat as an Independent.
References
[edit]- ^ "2004 State General Election: Statistical Returns" (PDF). ecq.qld.gov.au. Electoral Commission of Queensland (ECQ). August 2004.
- ^ Electoral Commission of Queensland (August 2004). Queensland Election 2004: Statistical Returns. Electoral Commission Queensland. p. 6. ISBN 0-7242-6851-0.
- ^ Australian Government and Politics Database. "Parliament of Queensland, Assembly election, 7 February 2004". Archived from the original on 18 January 2015. Retrieved 22 February 2009.

