Chichester District Council in West Sussex, England is elected every four years. Since the last boundary changes in 2019, 36 councillors have been elected from 21 wards.
Council elections
[edit]- 1973 Chichester District Council election
- 1976 Chichester District Council election
- 1979 Chichester District Council election (New ward boundaries)[1]
- 1983 Chichester District Council election
- 1987 Chichester District Council election (District boundary changes took place but the number of seats remained the same)[2]
- 1991 Chichester District Council election
- 1995 Chichester District Council election (District boundary changes took place but the number of seats remained the same)[3][4]
- 1999 Chichester District Council election
- 2003 Chichester District Council election (New ward boundaries reduced the number of seats by 2)[5][6]
- 2007 Chichester District Council election
- 2011 Chichester District Council election
- 2015 Chichester District Council election
- 2019 Chichester District Council election (New ward boundaries reduced the number of seats by 12)[7]
- 2023 Chichester District Council election
Election results
[edit]| Overall control | Conservative | Lib Dems | Labour | Green | Local Alliance | Independent | |||||||
| 2023 | LD | 5 | 25 | - | 2 | 4 | - | ||||||
| 2019 | NOC | 18 | 11 | 2 | 2 | 2 | 1 | ||||||
| 2015 | Con | 42 | 3 | - | - | - | 3 | ||||||
| 2011 | Con | 38 | 8 | - | - | - | 2 | ||||||
| 2007 | Con | 34 | 11 | - | - | - | 3 | ||||||
| 2003 | Con | 26 | 21 | - | - | - | 1 | ||||||
Results maps
[edit]-
 2019 results map
 -
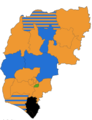 2023 results map


By-election results
[edit]1995–1999
[edit]| Party | Candidate | Votes | % | ±% | |
|---|---|---|---|---|---|
| Conservative | 607 | 51.8 | +7.5 | ||
| Liberal Democrats | 482 | 41.1 | −14.6 | ||
| Labour | 65 | 5.5 | +5.5 | ||
| Independent | 18 | 1.5 | +1.5 | ||
| Majority | 125 | 10.7 | |||
| Turnout | 1,172 | ||||
| Conservative gain from Liberal Democrats | Swing | ||||
| Party | Candidate | Votes | % | ±% | |
|---|---|---|---|---|---|
| Liberal Democrats | 673 | 50.2 | −2.0 | ||
| Conservative | 425 | 31.7 | +7.8 | ||
| Labour | 242 | 18.1 | −5.8 | ||
| Majority | 248 | 18.5 | |||
| Turnout | 1,340 | ||||
| Liberal Democrats hold | Swing | ||||
| Party | Candidate | Votes | % | ±% | |
|---|---|---|---|---|---|
| Liberal Democrats | 688 | 56.3 | +0.4 | ||
| Conservative | 341 | 27.9 | +5.2 | ||
| Labour | 193 | 15.8 | −5.6 | ||
| Majority | 347 | 28.4 | |||
| Turnout | 1,222 | ||||
| Liberal Democrats hold | Swing | ||||
1999–2003
[edit]| Party | Candidate | Votes | % | ±% | |
|---|---|---|---|---|---|
| Liberal Democrats | 595 | 66.0 | +35.5 | ||
| Conservative | 249 | 27.6 | −35.7 | ||
| UKIP | 57 | 6.3 | +6.3 | ||
| Majority | 346 | 38.4 | |||
| Turnout | 901 | 35.4 | |||
| Liberal Democrats gain from Conservative | Swing | ||||
| Party | Candidate | Votes | % | ±% | |
|---|---|---|---|---|---|
| Conservative | 418 | 51.7 | −10.3 | ||
| UKIP | 186 | 23.0 | +23.0 | ||
| Liberal Democrats | 159 | 19.7 | −6.7 | ||
| Labour | 46 | 5.7 | −5.9 | ||
| Majority | 232 | 28.7 | |||
| Turnout | 809 | 32.9 | |||
| Conservative hold | Swing | ||||
2003–2007
[edit]| Party | Candidate | Votes | % | ±% | |
|---|---|---|---|---|---|
| Independent | Keith Smith | 427 | 35.8 | +35.8 | |
| Liberal Democrats | Simon Green | 421 | 35.3 | +2.7 | |
| Conservative | Jane Chevis | 231 | 19.4 | −15.8 | |
| UKIP | Roger Wilson | 69 | 5.8 | −4.2 | |
| Labour | Patrick O'Sullivan | 45 | 3.8 | −11.1 | |
| Majority | 6 | 0.5 | |||
| Turnout | 1,193 | 33.6 | |||
| Independent gain from Liberal Democrats | Swing | ||||
| Party | Candidate | Votes | % | ±% | |
|---|---|---|---|---|---|
| Conservative | Paul Mackey | 471 | 52.6 | −10.4 | |
| Liberal Democrats | Raymond Cooper | 363 | 40.5 | +3.5 | |
| UKIP | Vivienne Moran | 62 | 6.9 | +6.9 | |
| Majority | 108 | 12.1 | |||
| Turnout | 896 | 24.2 | |||
| Conservative hold | Swing | ||||
| Party | Candidate | Votes | % | ±% | |
|---|---|---|---|---|---|
| Liberal Democrats | Jacqueline Cook | 485 | 35.3 | +35.3 | |
| Conservative | Nicholas Bromfield | 414 | 30.1 | −18.0 | |
| UKIP | Bernard Smith | 328 | 23.9 | +3.7 | |
| Labour | Ian Bell | 147 | 10.7 | −21.0 | |
| Majority | 71 | 5.2 | |||
| Turnout | 1,374 | 28.5 | |||
| Liberal Democrats gain from Conservative | Swing | ||||
| Party | Candidate | Votes | % | ±% | |
|---|---|---|---|---|---|
| Liberal Democrats | Michael Denmead | 611 | 62.1 | +20.9 | |
| Conservative | Stuart King | 262 | 26.6 | +7.4 | |
| UKIP | James McCulloch | 58 | 6.0 | −9.6 | |
| BNP | Andrew Emerson | 52 | 5.3 | +5.3 | |
| Majority | 349 | 35.5 | |||
| Turnout | 983 | 17.4 | |||
| Liberal Democrats hold | Swing | ||||
| Party | Candidate | Votes | % | ±% | |
|---|---|---|---|---|---|
| Conservative | Brenda Esther Atlee | 278 | 44.1 | +2.9 | |
| Liberal Democrats | Betty Rudkin | 275 | 43.7 | −8.4 | |
| BNP | Andrew Emerson | 41 | 6.5 | +6.5 | |
| UKIP | James McCulloch | 22 | 3.5 | +3.5 | |
| Labour | Patrick Joseph O'Sullivan | 14 | 2.2 | −4.5 | |
| Majority | 3 | 0.4 | |||
| Turnout | 630 | 36.0 | |||
| Conservative gain from Liberal Democrats | Swing | ||||
| Party | Candidate | Votes | % | ±% | |
|---|---|---|---|---|---|
| Conservative | Justus Adriaan Pieter Montyn | 868 | 57.5 | +5.6 | |
| Independent | David Hopson | 330 | 21.9 | +21.9 | |
| Liberal Democrats | Roger Walter Tilbury | 139 | 9.2 | −9.9 | |
| BNP | Andrew Emerson | 123 | 8.2 | +8.2 | |
| Labour | Gordon Trevor Churchill | 48 | 3.2 | −2.7 | |
| Majority | 538 | 35.6 | |||
| Turnout | 1,508 | 37.5 | |||
| Conservative hold | Swing | ||||
2007–2011
[edit]| Party | Candidate | Votes | % | ±% | |
|---|---|---|---|---|---|
| Conservative | John Francis Elliott | 431 | 69.3 | +14.0 | |
| Liberal Democrats | David Hares | 191 | 30.7 | +30.7 | |
| Majority | 240 | 38.6 | |||
| Turnout | 622 | 34.4 | |||
| Conservative hold | Swing | ||||
| Party | Candidate | Votes | % | ±% | |
|---|---|---|---|---|---|
| Conservative | Graeme Barrett | 410 | 40.3 | +6.6 | |
| Liberal Democrats | Mary Ellen Green | 364 | 35.8 | +7.0 | |
| BNP | Andrew Emerson | 125 | 12.3 | +12.3 | |
| Labour | Patrick Joseph O'Sullivan | 69 | 6.8 | −0.4 | |
| UKIP | James McCulloch | 49 | 4.8 | +4.8 | |
| Majority | 46 | 4.5 | |||
| Turnout | 1,017 | 25.1 | |||
| Conservative hold | Swing | ||||
| Party | Candidate | Votes | % | ±% | |
|---|---|---|---|---|---|
| Conservative | John Andrews | 455 | 57.1 | −21.0 | |
| Liberal Democrats | Raymond Ernest John Cooper | 342 | 42.9 | +21.0 | |
| Majority | 113 | 14.2 | |||
| Turnout | 797 | 21.3 | |||
| Conservative hold | Swing | ||||
| Party | Candidate | Votes | % | ±% | |
|---|---|---|---|---|---|
| Conservative | Philippa Hardwick | 504 | 57.7 | −20.4 | |
| Liberal Democrats | Ray Cooper | 301 | 34.4 | +12.5 | |
| BNP | Andrew Emerson | 69 | 7.9 | +7.9 | |
| Majority | 203 | 23.3 | |||
| Turnout | 874 | 23.3 | |||
| Conservative hold | Swing | ||||
2011–2015
[edit]| Party | Candidate | Votes | % | ±% | |
|---|---|---|---|---|---|
| Conservative | Nick Thomas | 455 | 52.7 | −8.3 | |
| Liberal Democrats | Ray Cooper | 408 | 47.3 | +20.6 | |
| Majority | 47 | 5.4 | |||
| Turnout | 863 | ||||
| Conservative hold | Swing | ||||
| Party | Candidate | Votes | % | ±% | |
|---|---|---|---|---|---|
| Conservative | Mark Dunn | 184 | 41.3 | −18.6 | |
| UKIP | Alicia Denny | 106 | 23.8 | +23.8 | |
| Green | Thomas French | 85 | 19.1 | +19.1 | |
| Liberal Democrats | Philip MacDougall | 68 | 15.2 | −24.9 | |
| Patria | Andrew Emerson | 3 | 0.6 | +0.6 | |
| Majority | 78 | 17.5 | |||
| Turnout | 446 | ||||
| Conservative hold | Swing | ||||
| Party | Candidate | Votes | % | ±% | |
|---|---|---|---|---|---|
| Conservative | Gillian Keegan | 342 | 71.3 | −19.8 | |
| UKIP | Elena McCloskey | 106 | 28.8 | +28.8 | |
| Majority | 204 | 42.5 | |||
| Turnout | 480 | ||||
| Conservative hold | Swing | ||||
2015–2019
[edit]| Party | Candidate | Votes | % | ±% | |
|---|---|---|---|---|---|
| Liberal Democrats | Jonathan Brown | 646 | 57.7 | +15.8 | |
| Conservative | David Harwood | 289 | 25.8 | −32.3 | |
| UKIP | Patricia Hunt | 132 | 11.8 | +11.8 | |
| Labour | Rebecca Hamlet | 53 | 4.7 | +4.7 | |
| Majority | 357 | 31.9 | |||
| Turnout | 1,120 | ||||
| Liberal Democrats gain from Conservative | Swing | ||||
| Party | Candidate | Votes | % | ±% | |
|---|---|---|---|---|---|
| Conservative | Andy Collins | 859 | 57.0 | −4.4 | |
| Liberal Democrats | Adrian Moss | 649 | 43.0 | +4.4 | |
| Majority | 210 | 14.0 | |||
| Turnout | 1,508 | ||||
| Conservative hold | Swing | ||||
| Party | Candidate | Votes | % | ±% | |
|---|---|---|---|---|---|
| Conservative | Keith Martin | 965 | 72.6 | +20.7 | |
| Labour | Joe O'Sullivan | 177 | 13.3 | −6.6 | |
| Liberal Democrats | Jane Scotland | 169 | 12.7 | +12.7 | |
| Patria | Andrew Emerson | 18 | 1.4 | +1.4 | |
| Majority | 788 | 59.3 | |||
| Turnout | 1,329 | ||||
| Conservative hold | Swing | ||||
| Party | Candidate | Votes | % | ±% | |
|---|---|---|---|---|---|
| Conservative | Chris Page | 471 | 68.1 | N/A | |
| Liberal Democrats | Robert Linzell | 221 | 31.9 | N/A | |
| Majority | 250 | 36.2 | |||
| Turnout | 692 | ||||
| Conservative hold | Swing | ||||
| Party | Candidate | Votes | % | ±% | |
|---|---|---|---|---|---|
| Conservative | Peter Wilding | 1,042 | 73.6 | −1.2 | |
| Liberal Democrats | Raymond Cooper | 373 | 26.4 | +1.2 | |
| Majority | 669 | 47.2 | |||
| Turnout | 1,415 | ||||
| Conservative hold | Swing | ||||
| Party | Candidate | Votes | % | ±% | |
|---|---|---|---|---|---|
| Liberal Democrats | Adrian Moss | 459 | 54.6 | +3.3 | |
| Conservative | Libby Alexander | 294 | 35.0 | −2.2 | |
| Labour | Kevin Hughes | 88 | 10.5 | +10.5 | |
| Majority | 165 | 19.6 | |||
| Turnout | 841 | ||||
| Liberal Democrats hold | Swing | ||||
| Party | Candidate | Votes | % | ±% | |
|---|---|---|---|---|---|
| Liberal Democrats | Kate O'Kelly | 444 | 55.8 | +55.8 | |
| Conservative | Robert Pettigrew | 319 | 40.1 | −27.3 | |
| Labour | Ray Davey | 21 | 2.6 | +2.6 | |
| Green | Philip Naber | 12 | 1.5 | −18.2 | |
| Majority | 125 | 15.7 | |||
| Turnout | 796 | ||||
| Liberal Democrats gain from Conservative | Swing | ||||
2019–2023
[edit]| Party | Candidate | Votes | % | ±% | |
|---|---|---|---|---|---|
| Conservative | Janet Duncton | 1,005 | 61.8 | +17.4 | |
| Liberal Democrats | Alexander Jeffery | 486 | 29.9 | −25.7 | |
| Green | Francesca Chetta | 126 | 7.7 | +7.7 | |
| Patria | Andrew Emerson | 9 | 0.6 | +0.6 | |
| Majority | 519 | 31.9 | |||
| Turnout | 1,626 | ||||
| Conservative gain from Liberal Democrats | Swing | ||||
| Party | Candidate | Votes | % | ±% | |
|---|---|---|---|---|---|
| Liberal Democrats | Bill Brisbane | 430 | 43.0 | +24.7 | |
| Conservative | Jane Kilby | 310 | 31.0 | +6.5 | |
| Labour | Clare Walsh | 261 | 26.1 | −3.7 | |
| Majority | 120 | 12.0 | |||
| Turnout | 1,001 | ||||
| Liberal Democrats gain from Labour | Swing | ||||
References
[edit]- ^ The District of Chichester (Electoral Arrangements) Order 1977
- ^ The Arun and Chichester (Areas) Order 1985
- ^ legislation.gov.uk – The Dorset, Hampshire, West Sussex and Wiltshire (County Boundaries) Order 1991. Retrieved on 5 November 2015.
- ^ legislation.gov.uk – The Surrey and West Sussex (County Boundaries) Order 1992. Retrieved on 5 November 2015.
- ^ "Local elections". BBC News Online. Retrieved 5 September 2009.
- ^ legislation.gov.uk – The District of Chichester (Electoral Changes) Order 2002. Retrieved on 4 October 2015.
- ^ "The Chichester (Electoral Changes) Order 2017", legislation.gov.uk, The National Archives, SI 2017/475, retrieved 27 January 2024
- ^ a b "District By Election Results 2003". Chichester District Online. Archived from the original on 11 June 2004. Retrieved 7 February 2010.
- ^ "By Election Results 2006". Chichester District Council. Archived from the original on 14 June 2011. Retrieved 5 September 2009.
- ^ "Conservatives win Bury by-election". Chichester District Council. Archived from the original on 14 June 2011. Retrieved 20 July 2008.
- ^ "Conservative wins East Wittering by-election". Chichester District Council. Archived from the original on 29 September 2011. Retrieved 5 September 2009.
- ^ "Conservatives win Plaistow by-election". Chichester District Council. Archived from the original on 14 June 2011. Retrieved 5 September 2009.
- ^ "Conservatives win Plaistow by-election". Chichester District Council. 12 February 2010. Archived from the original on 14 June 2011. Retrieved 12 February 2010.
- ^ "Local Elections Archive Project — Plaistow Ward". www.andrewteale.me.uk. Retrieved 25 September 2023.
- ^ "Local Elections Archive Project — Westbourne Ward". www.andrewteale.me.uk. Retrieved 25 September 2023.
- ^ "Local Elections Archive Project — Rogate Ward". www.andrewteale.me.uk. Retrieved 25 September 2023.
- ^ "Local Elections Archive Project — Plaistow Ward". www.andrewteale.me.uk. Retrieved 25 September 2023.
- ^ "Local Elections Archive Project — Bosham Ward". www.andrewteale.me.uk. Retrieved 25 September 2023.
- ^ "Local Elections Archive Project — East Wittering Ward". www.andrewteale.me.uk. Retrieved 25 September 2023.
- ^ "Local Elections Archive Project — North Mundham Ward". www.andrewteale.me.uk. Retrieved 25 September 2023.
- ^ "Local Elections Archive Project — Plaistow Ward". www.andrewteale.me.uk. Retrieved 25 September 2023.
- ^ "Local Elections Archive Project — Fishbourne Ward". www.andrewteale.me.uk. Retrieved 25 September 2023.
- ^ "Local Elections Archive Project — Rogate Ward". www.andrewteale.me.uk. Retrieved 25 September 2023.
- ^ "Local Elections Archive Project — Loxwood Ward". www.andrewteale.me.uk. Retrieved 25 September 2023.
- ^ "Local Elections Archive Project — Chichester East Ward". www.andrewteale.me.uk. Retrieved 25 September 2023.
- By-election results Archived 29 March 2010 at the Wayback Machine
External links
[edit]| West Sussex CC | |
|---|---|
| Adur | |
| Arun | |
| Chichester | |
| Crawley | |
| Horsham | |
| Mid Sussex | |
| Worthing | |
| |