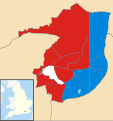
One third of Crawley Borough Council in West Sussex, England is elected each year, followed by one year without election. Since the last boundary changes in 2019, 36 councillors have been elected from 13 wards.[1]
Political control
[edit]From the first elections to the council in 1973 following the reforms of the Local Government Act 1972, political control of the council has been held by the following parties:[2]
| Party in control | Years | |
|---|---|---|
| Labour | 1973–2006 | |
| Conservative | 2006 | |
| No overall control | 2006–2007 | |
| Conservative | 2007–2014 | |
| Labour | 2014–2020 | |
| No overall control | 2020–2022 | |
| Labour | 2022–present | |
Leadership
[edit]The leaders of the council since 1973 have been:[3]
| Councillor | Party | From | To | |
|---|---|---|---|---|
| George Waller | Labour | 1973 | 1978 | |
| Ben Clay | Labour | 1978 | 1980 | |
| Alf Pegler | Labour | 1980 | 1982 | |
| Tony Edwards | Labour | 1982 | 1983 | |
| Ben Clay | Labour | 1983 | 1986 | |
| Alf Pegler | Labour | 1986 | 1996 | |
| Tony Edwards | Labour | 1996 | 2000 | |
| Chris Redmayne | Labour | 2000 | 26 May 2006 | |
| Bob Lanzer | Conservative | 26 May 2006 | Aug 2013 | |
| Howard Bloom | Conservative | 26 Sep 2013 | 13 Jun 2014 | |
| Peter Lamb | Labour | 13 Jun 2014 | 27 May 2022 | |
| Michael Jones | Labour | 27 May 2022 | ||
Council elections
[edit]Summary of the council composition after recent council elections, click on the year for full details of each election. Boundary changes took place for the 2004 election increasing the number of seats by 5, leading to the whole council being elected in that year.[4]
- 1973 Crawley Borough Council election
- 1976 Crawley Borough Council election
- 1979 Crawley Borough Council election (New ward boundaries)[5]
- 1980 Crawley Borough Council election
- 1982 Crawley Borough Council election
- 1983 Crawley Borough Council election (Borough boundary changes took place but the number of seats remained the same)[6]
- 1984 Crawley Borough Council election
- 1986 Crawley Borough Council election
- 1987 Crawley Borough Council election
- 1988 Crawley Borough Council election
- 1990 Crawley Borough Council election
- 1991 Crawley Borough Council election
| Year | Labour | Conservative | Liberal Democrats | UKIP | Notes | ||||
| 1992[7] | 22 | 9 | 1 | 0 | |||||
| 1994[8] | 23 | 7 | 2 | 0 | Borough boundary changes took place but the number of seats remained the same[9] | ||||
| 1995[10] | 26 | 4 | 2 | 0 | |||||
| 1996[11] | 28 | 2 | 2 | 0 | |||||
| 1998[12] | 27 | 3 | 2 | 0 | |||||
| 1999[13] | 25 | 5 | 2 | 0 | |||||
| 2000[14] | 24 | 6 | 2 | 0 | |||||
| 2002[15] | 23 | 7 | 2 | 0 | |||||
| 2003[16] | 22 | 8 | 2 | 0 | |||||
| 2004[4] | 19 | 16 | 2 | 0 | Borough boundary changes took place increasing the number of seats from 32 to 37.[17] | ||||
| 2006[18] | 16 | 19 | 2 | 0 | |||||
| 2007[19] | 12 | 22 | 3 | 0 | |||||
| 2008[20] | 9 | 26 | 2 | 0 | |||||
| 2010[21] | 11 | 26 | 0 | 0 | |||||
| 2011[2] | 13 | 24 | 0 | 0 | |||||
| 2012 | 16 | 21 | 0 | 0 | |||||
| 2014 | 20 | 16 | 0 | 1 | |||||
| 2015[22] | 19 | 18 | 0 | 0 | |||||
| 2016[23] | 20 | 17 | 0 | 0 | |||||
| 2018[24] | 20 | 17 | 0 | 0 | |||||
| 2019[25] | 19 | 17 | 0 | 0 | Borough boundary changes took place reducing the number of seats from 37 to 36. | ||||
| 2021 | 17 | 18 | 0 | 0 | In addition, one existing Independent former Labour councillor remained on the council. | ||||
| 2022 | 18 | 17 | 0 | 0 | One by-election was still ongoing, subsequently won by Labour. | ||||
| 2023 | 20 | 16 | 0 | 0 | |||||
| 2024 | 25 | 11 | 0 | 0 | |||||
Borough result maps
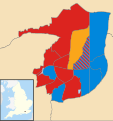
[edit]-
2004 results map
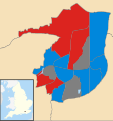
-
2006 results map
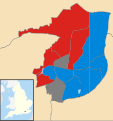
-
2007 results map
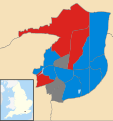
-
2008 results map
-
2010 results map
-
2011 results map
-
2012 results map
-
2014 results map
-
2015 results map
-
2016 results map
-
2018 results map
-
2019 results map
-
2021 results map
-
2022 results map
-
2023 results map
-
2024 results map
By-election results
[edit]By-elections occur when seats become vacant between council elections. Below is a summary of recent by-elections;[26] full by-election results can be found by clicking on the by-election name.
| By-election | Date | Incumbent party | Winning party | ||
|---|---|---|---|---|---|
| Langley Green | 28 November 1996 | Labour | Labour | ||
| West Green by-election | 14 September 2000 | Labour | Labour | ||
| Pound Hill South | 2 October 2003 | Conservative | Conservative | ||
| Northgate | 15 October 2009 | Liberal Democrats | Labour | ||
| Tilgate | 7 October 2010 | Conservative | Labour | ||
| Southgate | 9 October 2014 | UKIP | Labour | ||
| Maidenbower | 4 May 2017 | Conservative | Conservative | ||
| Pound Hill South and Worth | 8 June 2017 | Conservative | Conservative | ||
| Tilgate | 26 September 2019 | Conservative | Conservative | ||
| Southgate | 9 June 2022 | Labour | Labour | ||
2002-2006
[edit]| Party | Candidate | Votes | % | ±% | |
|---|---|---|---|---|---|
| Conservative | 548 | 51.3 | −5.8 | ||
| Labour | 234 | 21.9 | −3.9 | ||
| Liberal Democrats | Eddie Reay | 210 | 19.7 | +2.6 | |
| Green | 76 | 7.1 | +7.1 | ||
| Majority | 314 | 29.4 | |||
| Turnout | 1,068 | 19.8 | |||
| Conservative hold | Swing | ||||
2006-2010
[edit]| Party | Candidate | Votes | % | ±% | |
|---|---|---|---|---|---|
| Labour | Geraint Thomas | 527 | 43.3 | +19.0 | |
| Conservative | Ryan Smith | 446 | 36.7 | +18.9 | |
| Liberal Democrats | Darren Wise | 230 | 18.9 | −26.6 | |
| Justice Party | Arshad Khan | 13 | 1.1 | −8.4 | |
| Majority | 81 | 6.6 | |||
| Turnout | 1,216 | 31.3 | |||
| Labour gain from Liberal Democrats | Swing | ||||
2010-2014
[edit]| Party | Candidate | Votes | % | ±% | |
|---|---|---|---|---|---|
| Labour | Colin Lloyd | 764 | 50.8 | +15.2 | |
| Conservative | Ray Ward | 656 | 43.9 | +2.8 | |
| UKIP | Maurice Day | 79 | 5.2 | +5.2 | |
| Justice Party | Arshad Khan | 6 | 0.4 | +0.4 | |
| Majority | 108 | 6.9 | |||
| Turnout | 1,505 | 32 | −7.3 | ||
| Labour gain from Conservative | Swing | ||||
2014-2018
[edit]| Party | Candidate | Votes | % | ±% | |
|---|---|---|---|---|---|
| Labour | Michael Pickett | 733 | 44.1 | +9 | |
| Conservative | Jan Tarrant | 642 | 38.6 | +6.1 | |
| UKIP | Simon Darroch | 277 | 16.7 | −6.7 | |
| Justice Party | Arshad Khan | 10 | 0.6 | +0.6 | |
| Majority | 91 | 5.5 | |||
| Turnout | 1,662 | 25 | −13.3 | ||
| Labour gain from UKIP | Swing | ||||
| Party | Candidate | Votes | % | ±% | |
|---|---|---|---|---|---|
| Conservative | Nigel Boxall | 1,377 | 65.1 | −5.8 | |
| Labour | Morgan Flack | 413 | 19.5 | +0.5 | |
| Liberal Democrats | Paul Cummings | 178 | 8.4 | +8.4 | |
| UKIP | Allan Griffiths | 100 | 4.7 | +4.7 | |
| Green | Richard Kail | 48 | 2.3 | −7.8 | |
| Majority | 964 | 45.6 | |||
| Turnout | 2,116 | ||||
| Conservative hold | Swing | ||||
| Party | Candidate | Votes | % | ±% | |
|---|---|---|---|---|---|
| Conservative | Alison Pendlington | 2,435 | 52.2 | −7.5 | |
| Labour | Colin Flack | 1,677 | 36.0 | +2.6 | |
| Green | Daniel Elliott | 193 | 4.1 | −2.8 | |
| Liberal Democrats | Harry Old | 192 | 4.1 | +4.1 | |
| UKIP | Janet Setford-Thompson | 165 | 3.5 | +3.5 | |
| Majority | 758 | 16.3 | |||
| Turnout | 4,662 | ||||
| Conservative hold | Swing | ||||
2018-2022
[edit]| Party | Candidate | Votes | % | ±% | |
|---|---|---|---|---|---|
| Conservative | Maureen Mwagale | 741 | 57.0 | ||
| Labour | Kiran Khan | 396 | 30.5 | ||
| Liberal Democrats | Angharad Old | 82 | 6.3 | ||
| Green | Derek Hardman | 75 | 5.8 | ||
| Justice Party | Arshad Khan | 5 | 0.4 | ||
| Majority | 345 | 26.6 | |||
| Turnout | 1,299 | ||||
| Conservative hold | Swing | ||||
2022-2026
[edit]| Party | Candidate | Votes | % | ±% | |
|---|---|---|---|---|---|
| Labour | Bob Noyce | 938 | 50.1 | +3.5 | |
| Conservative | Jan Tarrant | 790 | 42.2 | +2.8 | |
| Green | Richard Kail | 144 | 7.7 | +1.6 | |
| Majority | 148 | 7.9 | |||
| Turnout | 1,872 | ||||
| Labour hold | Swing | ||||
| Party | Candidate | Votes | % | ±% | |
|---|---|---|---|---|---|
| Conservative | Imtiaz Khan | 1,606 | 39.6 | −4.3 | |
| Green | Max Perry | 1,227 | 30.2 | +1.5 | |
| Labour | Matt Pritchard | 1,226 | 30.2 | +2.8 | |
| Majority | 379 | 9.3 | |||
| Turnout | 4,059 | ||||
| Conservative hold | Swing | ||||
| Party | Candidate | Votes | % | ±% | |
|---|---|---|---|---|---|
| Labour | Khayla Abu Mosa | 704 | 38.5 | −15.0 | |
| Conservative | Jonathan Purdy | 492 | 26.9 | −2.0 | |
| Reform UK | Tim Charters | 292 | 16.0 | +16.0 | |
| Green | Nick Park | 174 | 9.5 | −3.0 | |
| Workers Party | Linda Bamieh | 133 | 7.3 | +7.3 | |
| TUSC | Robin Burnham | 35 | 1.9 | −3.2 | |
| Majority | 212 | 11.6 | |||
| Turnout | 1,830 | ||||
| Labour hold | Swing | ||||
References
[edit]- ^ "Councillors and Elections". Crawley Borough Council. Archived from the original on 18 March 2011. Retrieved 17 October 2009.
- ^ a b "England council elections". BBC News Online. 10 May 2011. Retrieved 8 January 2012.
- ^ "Council minutes". Crawley Borough Council. Retrieved 22 July 2022.
- ^ a b "Crawley council". BBC News Online. 12 June 2004. Retrieved 8 January 2012.
- ^ The Borough of Crawley (Electoral Arrangements) Order 1977
- ^ The Crawley, Horsham and Mid Sussex (Areas) Order 1982
- ^ "Local election results 1992". The Times. 9 May 1992.
- ^ "Non Metropolitan Districts". The Times. 7 May 1994.
- ^ legislation.gov.uk - The Surrey and West Sussex (County Boundaries) Order 1992. Retrieved on 5 November 2015.
- ^ "Complete list of results from thursday's council elections". The Times. 6 May 1995.
- ^ "Election Results Round-Up". The Times. 3 May 1996.
- ^ "Policy and politics: Local Elections: Analysis: Council poll results". The Guardian. 9 May 1998. p. 16.
- ^ "How the nations voted". The Times. 8 May 1999. p. 48.
- ^ "Crawley". BBC News Online. Retrieved 8 January 2012.
- ^ "Crawley". BBC News Online. Retrieved 8 January 2012.
- ^ "Local elections". BBC News Online. Retrieved 8 January 2012.
- ^ legislation.gov.uk - The Borough of Crawley (Electoral Changes) Order 2002. Retrieved on 4 October 2015.
- ^ "Local elections: Crawley". BBC News Online. 5 May 2006. Retrieved 8 January 2012.
- ^ "Crawley". BBC News Online. 8 May 2007. Retrieved 8 January 2012.
- ^ "Crawley". BBC News Online. 2 May 2008. Retrieved 8 January 2012.
- ^ "Crawley". BBC News Online. 7 May 2010. Retrieved 8 January 2012.
- ^ Steven Ayres (18 June 2015). "Local elections 2015". House of Commons Library. p. 18.
- ^ Elise Uberoi; Chris Watson; Richard Keen (19 May 2016). "Local elections 2016". House of Commons Library. p. 22.
- ^ Noel Dempsey (14 May 2018). "Local Elections 2018" (PDF). House of Commons Library. p. 20.
- ^ "Borough Election 2019 - Thursday, 2nd May, 2019". Crawley Borough Council.
- ^ "Local Authority Byelection Results". Archived from the original on 29 March 2010. Retrieved 8 January 2012.
- ^ "Labour wins Northgate by-election". Crawley Observer. 16 October 2009. Retrieved 17 October 2009.
- ^ "By-elections October 2010". Crawley Borough Council. 7 October 2009. Archived from the original on 28 September 2011. Retrieved 9 October 2010.
- ^ "BLOG : BY-ELECTION RESULTS: CRAWLEY BC, SOUTHGATE – 9 OCTOBER 2014". ALDC. 17 October 2014. Retrieved 17 October 2014.
- ^ "Local Elections Archive Project — Maidenbower Ward". www.andrewteale.me.uk. Retrieved 14 May 2022.
- ^ "Local Elections Archive Project — Pound Hill South and Worth Ward". www.andrewteale.me.uk. Retrieved 14 May 2022.
- ^ "Local Elections Archive Project — Tilgate Ward". www.andrewteale.me.uk. Retrieved 14 May 2022.
- ^ "Local Elections Archive Project — Southgate Ward". www.andrewteale.me.uk. Retrieved 14 May 2022.
- ^ "Local Elections Archive Project — Maidenbower Ward". www.andrewteale.me.uk. Retrieved 5 November 2022.
- ^ "Local Elections Archive Project — Northgate and West Green Ward". www.andrewteale.me.uk. Retrieved 5 November 2022.
