
| Part of the LGBTQ rights series |
|
|
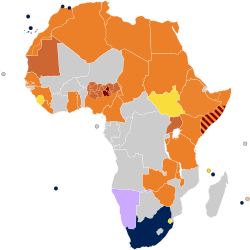
Debate has occurred throughout Africa over proposals to legalize same-sex marriage as well as civil unions.
Currently, South Africa is the only African country that performs and recognises same-sex marriage,[1] and Namibia is the only other which legally recognizes same-sex marriages performed abroad. In addition, the Spanish regions of the Canary Islands, Ceuta and Melilla, as well as the Portuguese territory of Madeira, the French territories of Mayotte and Réunion and the British Overseas Territory of St. Helena, Ascension and Tristan da Cunha recognize and perform same-sex marriage.
Civil partnerships or de facto unions are also recognized in South Africa, and the French, Spanish and Portuguese territories.
Current situation
[edit]National level
[edit]| Status | Country | Legal since | Country population (Last Census count) |
|---|---|---|---|
| Marriage (1 country) |
2006 | 54,956,900 | |
| Subtotal | — | — | 54,956,900 (4.5% of the African population) |
| Recognition of foreign marriage (1 country) |
2023 | 2,113,077 | |
| Subtotal | — | — | 2,113,077 (0.17% of the African population) |
| Subtotal | — | — | 57,069,977 (4.67% of the African population) |
| No recognition (44 countries) * same-sex sexual activity illegal | |||
| — | 40,400,000 | ||
| — | 25,789,024 | ||
| — | 10,872,298 | ||
| — | 2,250,260 | ||
| — | 23,439,189 | ||
| — | 539,560 | ||
| — | 4,594,621 | ||
| — | 13,670,084 | ||
| — | 795,601 | ||
| — | 942,333 | ||
| — | 96,474,100 | ||
| — | 1,221,490 | ||
| — | 4,954,645 | ||
| — | 1,343,098 | ||
| — | 102,403,196 | ||
| — | 2,051,363 | ||
| — | 27,043,093 | ||
| — | 12,395,924 | ||
| — | 1,815,698 | ||
| — | 23,740,424 | ||
| — | 2,203,821 | ||
| — | 4,503,000 | ||
| — | 6,293,253 | ||
| — | 24,894,551 | ||
| — | 18,091,575 | ||
| — | 4,301,018 | ||
| — | 1,262,132 | ||
| — | 33,848,242 | ||
| — | 28,829,476 | ||
| — | 20,672,987 | ||
| — | 185,989,640 | ||
| — | 5,125,821 | ||
| — | 199,910 | ||
| — | 15,411,614 | ||
| — | 94,228 | ||
| — | 7,075,641 | ||
| — | 14,317,996 | ||
| — | 12,230,730 | ||
| — | 55,572,201 | ||
| — | 7,965,055 | ||
| — | 11,304,482 | ||
| — | 16,591,390 | ||
| Subtotal | — | — | 873,514,764 (70% of the African population) |
| Constitutional ban on marriage (10 countries) * same-sex sexual activity illegal |
— | 20,107,509 | |
| 2005 | 10,524,117 | ||
| 2006 | 78,736,153 | ||
| 2024 | 1,979,786 | ||
| 2010 | 49,125,325 | ||
| 2023 | 14,517,176 | ||
| 2003 | 11,262,564 | ||
| — | 39,578,828 | ||
| 2005 | 41,487,965 | ||
| 2013 | 16,150,362 | ||
| Subtotal | — | — | 283,469,785 (23% of the African population) |
| Total | — | — | 1,214,062,706 (99.6% of the African population) |
Partially recognized and unrecognized states
[edit]| Status | Country | Since | State population (last estimate) |
|---|---|---|---|
| No recognition (2 state) * same-sex sexual activity illegal |
— | 100,000 | |
| — | 3,508,180 | ||
| Subtotal | — | — | 3,608,180 (0.3% of the African population) |
| Total | — | — | 3,608,180 (0.3% of the African population) |
Sub-national level
[edit]| Status | Country | Jurisdiction | Legal since | Jurisdiction population (last census) |
|---|---|---|---|---|
| Marriage (9 jurisdictions) |
2013 | — | ||
| 2013 | 256,518 | |||
| 2013 | 865,826 | |||
| 2010 | 289,000 | |||
| 2005 | 2,101,924 | |||
| 2005 | 82,376 | |||
| 2005 | 78,476 | |||
| 2017 | 5,633 | |||
| Subtotal | — | — | — | 3,679,753 (0.3% of the African population) |
| Total | — | — | — | 3,679,753 (0.3% of the African population) |
Public opinion
[edit]| Country | Pollster | Year | For | Against | Neutral[a] | Margin of error |
Source |
|---|---|---|---|---|---|---|---|
| Pew Research Center | 2023 | 9% | 90% | 1% | ±3.6% | [2] | |
| Lambda | 2017 | 28% (32%) |
60% (68%) |
12% | [3] | ||
| Pew Research Center | 2023 | 2% | 97% | 1% | ±3.6% | [2] | |
| Ipsos | 2023 | 57% |
29% [10% support some rights] |
14% | ±3.5% [b] | [4] |
See also
[edit]- LGBT rights in Africa
- Recognition of same-sex unions in the Americas
- Recognition of same-sex unions in Asia
- Recognition of same-sex unions in Europe
- Recognition of same-sex unions in Oceania
Notes
[edit]References
[edit]- ^ Wines, Michael (2 December 2005). "Same-Sex Unions to Become Legal in South Africa". New York Times. Retrieved February 5, 2018.
- ^ a b "How people in 24 countries view same-sex marriage". Retrieved 14 June 2023.
- ^ "Most Mozambicans against homosexual violence, study finds". MambaOnline - Gay South Africa online. June 4, 2018., (full report)
- ^ LGBT+ PRIDE 2023 GLOBAL SURVEY (PDF). Ipsos. 1 June 2023. Retrieved 12 June 2023.